- eISSN 2353-8414
- Phone.: +48 22 846 00 11 ext. 249
- E-mail: minib@ilot.lukasiewicz.gov.pl
Mapping research on user-generated content in the service sector — a bibliometric analysis
Elżbieta Wąsowicz-Zaborek*
International Business Department, Collegium of World Economy, SGH Warsaw School of Economics,
al. Niepodległości 162, 02-55, Warsaw, Poland
*E-mail: ewasowi@sgh.waw.pl
ORCID: 0000-0001-8422-4383
Abstract:
The Web 2.0 era and the following phases of web development bring new challenges to businesses, but also new opportunities to
establish and maintain relationships with market participants, indulge in direct contact with customers and learn about their needs, emotions and opinions. The advancement of content creation and sharing technologies creates an opportunity to collect information from anyone with access to the Internet. User-generated content (UGC) information is increasingly supporting decision-making and analysis for various types of business, management or marketing activities. Such information is also increasingly used as a source of data in scientific research. The present study seeks to evaluate the relevance of UGC in scientific research and the scope and ways in which content created by Internet users can be used by researchers of phenomena existing in the service sector. To achieve this goal, a bibliometric literature review (quantitative analysis of publications, identification of research collaborators, co-author analysis, co-citation analysis and co-word analysis) was conducted covering articles between 2012 and 2022 published in journals indexed in the Scopus database. The analysis used descriptive statistics and text and content analysis. A significant increase was observed in publications between 2020 and 2022. Among the various service branches, the researchers most often chose data sets in the form of comments posted online by customers of tourism industries, mainly those using accommodation services, but also restaurants. TripAdvisor was observed to be the most frequently used data source. In their analysis, the authors used both qualitative and quantitative methods, as well as a combination of them. It is observed that more sophisticated machine learning algorithms have been implemented for text analysis. Finally, the paper also presents future research recommendations.
MINIB, 2023, Vol. 49, Issue 3
DOI: 10.2478/minib-2023-0016
P. 65-100
Published 15 September 2023

Mapping research on user-generated content in the service sector — a bibliometric analysis
Introduction
The development of World Wide Web platforms and technologies has had a significant impact on marketing. Through the use of digital platforms, companies are now able to directly communicate with their target audiences and obtain quick response in the form of comments likes, clicks or shares. In online services such as e-commerce websites, social media (SM) platforms, web blogs and peer networking sites, customers have the ability to express their opinions regarding the products and services they have purchased and used. The comments and opinions of consumers regarding a good or service are included in the ‘word of mouth’ (‘WOM’) that nowadays is more often transmitted electronically, a phenomenon referred to as electronic word-of-mouth (eWOM). Internet consumers tend to have a greater level of credibility in eWOM than they have in case of traditional media (Cheung et al., 2008). According to Babić Rosario et al. (2016), the vast majority of clients read customer reviews posted online before making their final purchasing selections. According to Rasool et al. (2020), the development of electronic technology has increased the level of customer engagement that takes place in the virtual environment. In addition, the growth of SM has enabled customers to engage in conversations about businesses through the use of options such as liking, commenting and sharing. SM, such as Facebook, Twitter, Linkedin, YouTube and Instagram, are broad and important sources of social data about everyday life (Bello-Orgaz et al., 2016). Off-line behaviour is now largely transferred to the web, and thus becomes potentially available for analysis. The practice of communicating with one another verbally is now taking place on a much larger scale, and it is no longer limited by the geographical distance that separates individual consumers. The reviews circulate rapidly and have the potential to influence the potential purchasers’ buying decisions (Hutter et al., 2013). eWOM is important in influencing customer purchasing decisions, but it also helps service providers increase revenue and improve their standing in the industry. eWOM is primarily web user-generated content (UGC). According to the definition from the Organisation for Economic Cooperation and Development (OECD), UGC is ‘content that is publicly available over the internet reflecting a certain amount of creative input and created outside of professional routines and practices’ (OECD, 2007). Content generated by web users can relate practically to all spheres of human activity. It mirrors people’s attitudes and opinions. Some content is generated spontaneously, such as opinions shared on discussion groups or SM. Others may be created under the influence of the actions of businesses and other institutions that have an interest in engaging Internet users, for instance, on-site question boxes, electronic questionnaires, and games or competitions in which participants are encouraged to share texts or multimedia content in exchange for rewards. Additionally, content created online takes a variety of formats that go far beyond the standard text. These are so called ‘fun fiction’ texts, pictures, films, presentations and animated gifs, music, wiki, wlogs and questions and answers (Q&A) (Wąsowicz-Zaborek, 2020).
Considering the growing body of literature on the subject, it is necessary to synthesise it. Some authors have summarised the literature on UGC topics in the past. These reviews provide a comprehensive overview, but new, innovative publications are coming up all the time. Besides that, the authors either analysed research on UGC usage in general with no specific focus on the service sector (Cortis & Davis, 2021; Donthu et al., 2021; Iswari et al., 2022) or limited their analysis to a one or a few industries, especially hospitality or tourism (Lu & Stepchenkova, 2015; Manosso & Domareski Ruiz, 2021; Molina-Collado et al., 2022).
As the number of publications in the field grows rapidly, traditional reviewing techniques, which are primarily descriptive and narrative in nature, appear to be less effective in summarising the literature. Considering this phenomenon, this study employs bibliometric methodology to review the research published on the subject in the last 10 years. The article presents mainly a bibliometric analysis that gives a broad picture of the subject, its evolution and the relationships between related works. The review will also be used to analyse the content-miningrelated topics mentioned by academics. The purpose of this review is to describe UGC-based research in services. There are presented the findings of a search of the Scopus database, which has been undertaken at the end of 2022 to understand more about the state-of-the-art in mining of UGC, and to make recommendations for the potential future research in this area.
The paper is structured as follows: at the beginning the research method is described, then the main findings from bibliometric and systematic review are presented and at the end the conclusion and the future research recommendations are provided.
Research Method
The main goal of the research is the diagnosis of the UGC usage in research in service sector. The following research questions were posed as a further specification of the indicated research problem:
1. How has the usage of UGC in services research evolved in the last 10 years?
2. Which journals most often publish articles on UGC analysis in the service sector?
3. What methods have academics used to analyse UGC?
4. Which service industries have the authors studied?
5. Which data sources have been used by authors (which platforms)?
6. What have been the main themes of services research using UGC?
The bibliometric method is used for investigation of the topic of importance in services research employing UGC. Pritchard (1969) conceptualised bibliometrics as ‘the application of mathematics and statistical methods for books and other media.’ In that method the quantitative tools are used to analyse bibliographic data. It has developed into a respectable academic area that has relevance across several disciplines, including management and organisation (Zupic & Èater, 2015). Bibliometric methods, such as key word occurrence, bibliographic coupling or co-citation analysis, utilise bibliographic data from publishing databases, for example, Scopus or Web of Science to generate systemic pictures of scientific domains.
The two primary applications of bibliographic approaches are — performance analysis and science mapping. The purpose of performance analysis is to assess the research and publication output of individuals and organisations. The objective of science mapping is to reveal the structure and dynamics of scientific domains. The understanding of structure and evolution is helpful when an author’s objective is to review a certain research field. The subjective assessment of literature obtains quantitative rigour by bibliometric methodologies. Throughout a review, a researcher can provide evidence of theoretically derived categories (Zupic & Èater, 2015).
In the present study, an analysis of the trend in publications in journals indexed in Scopus database was performed. An initial query using the key words ‘user generated content’, ‘online reviews’ and ‘online text mining’ limited to ‘services’ returned 840 articles. It is important to emphasise that there were also other limitations set of the search — years of publication 2012–2022, English language, only final versions of papers and only journal articles. The searching was also limited to subject areas: ‘Social Sciences’, ‘Business, Management and Accounting’ (with subareas ‘Accounting’, ‘Business and International Management’, ‘Industrial relations’, ‘Management of Technology and Innovation’, ‘Marketing’, ‘Organisational Behaviour and Human Resource Management’, ‘Strategy and Management’ and ‘Tourism, Leisure and Hospitality Management’) and ‘Economics, Econometrics and Finance’.
The initial set of articles was then screened manually (mainly titles and abstracts, but also if necessary full texts of articles) to eliminate all papers potentially not suitable with reference to the research topic. This means that all the non-empirical papers were excluded, as were those in which the authors did not use UGC as a data source in the study, as well as those not bearing any relation to service sector. Resultantly, for the final analysis, a set of 433 articles was accepted.
Data preprocessing and formatting, as well as additional calculations in the further study and visualisations, were performed with the aid of Excel spreadsheets. The identified documents were coded and analysed with MaxQDA software to present the publication years, main publication journals, authors who published the most frequently and the countries presented, research methods utilised and services industries evaluated by these authors as well as their main sources of data.
For mapping, a few bibliometric techniques were implemented to identify potential research collaborators, co-author, co-citation analysis and co-word analysis. In this case, the VOSviewer version 1.6.18 was used.
Co-word analysis is a type of content analysis that utilises the words within documents to verify connections and construct a conceptual foundation of the subject. The approach is based on the assumption that when words appear frequently in different papers, it indicates that the constructs around these words are closely tied. Co-word analysis produces a network of themes and their relationships that represents the overall mental framework of a domain. Co-word analysis can be used to analyse whole texts, abstracts, document titles and keywords (Zupic & Èater, 2015). In this research, the co-word analysis is applied to keywords describing the analysed articles.
The method was used to extract thematic clusters, which were adopted as the main topics of the research conducted by the authors of the analysed articles. The results of the co-words analysis were also verified by analysing the frequency of words in the abstracts of the articles, with the use of MaxQDA. The conducted verification allowed for a better interpretation and confirmed the relevance of the identified clusters.
The research topics identified in the clusters were used for the further literature review. Using a narrative method, the basic conclusions drawn by the selected authors of the papers classified in each cluster were described.
The concept and process of the survey are visualised below.

Findings
Bibliometric analysis allowed the answering of research questions pertaining to the development and current status of the research using UGC.
Time of publication
In the analysed sample extracted from Scopus database, there were 433 papers published between 2012 and 2022. Looking at the distribution of publication frequency by year, it can be noted that until 2015 the number of publications did not exceed 10. In the following years, growth is observed. The highest increases were in 2017, when the number of publications nearly tripled compared to the previous year, and in 2020 when the number of publications exceeded 100 (compared to 60 from 2019). The great change observed in 2020 may be the result of an increase in the popularity of the subject, and the causative factor for this increase might in turn be the impact of studies published in previous years. This period also coincided with the first year of the COVID-19 pandemic when, due to restrictions introduced in most countries of the world, the conduct of traditional research based on survey methods or in-depth interviews was limited. Perhaps, therefore, the authors, looking for large, reliable datasets, decided to take a deeper look at the content generated by Internet users.

Publication venue
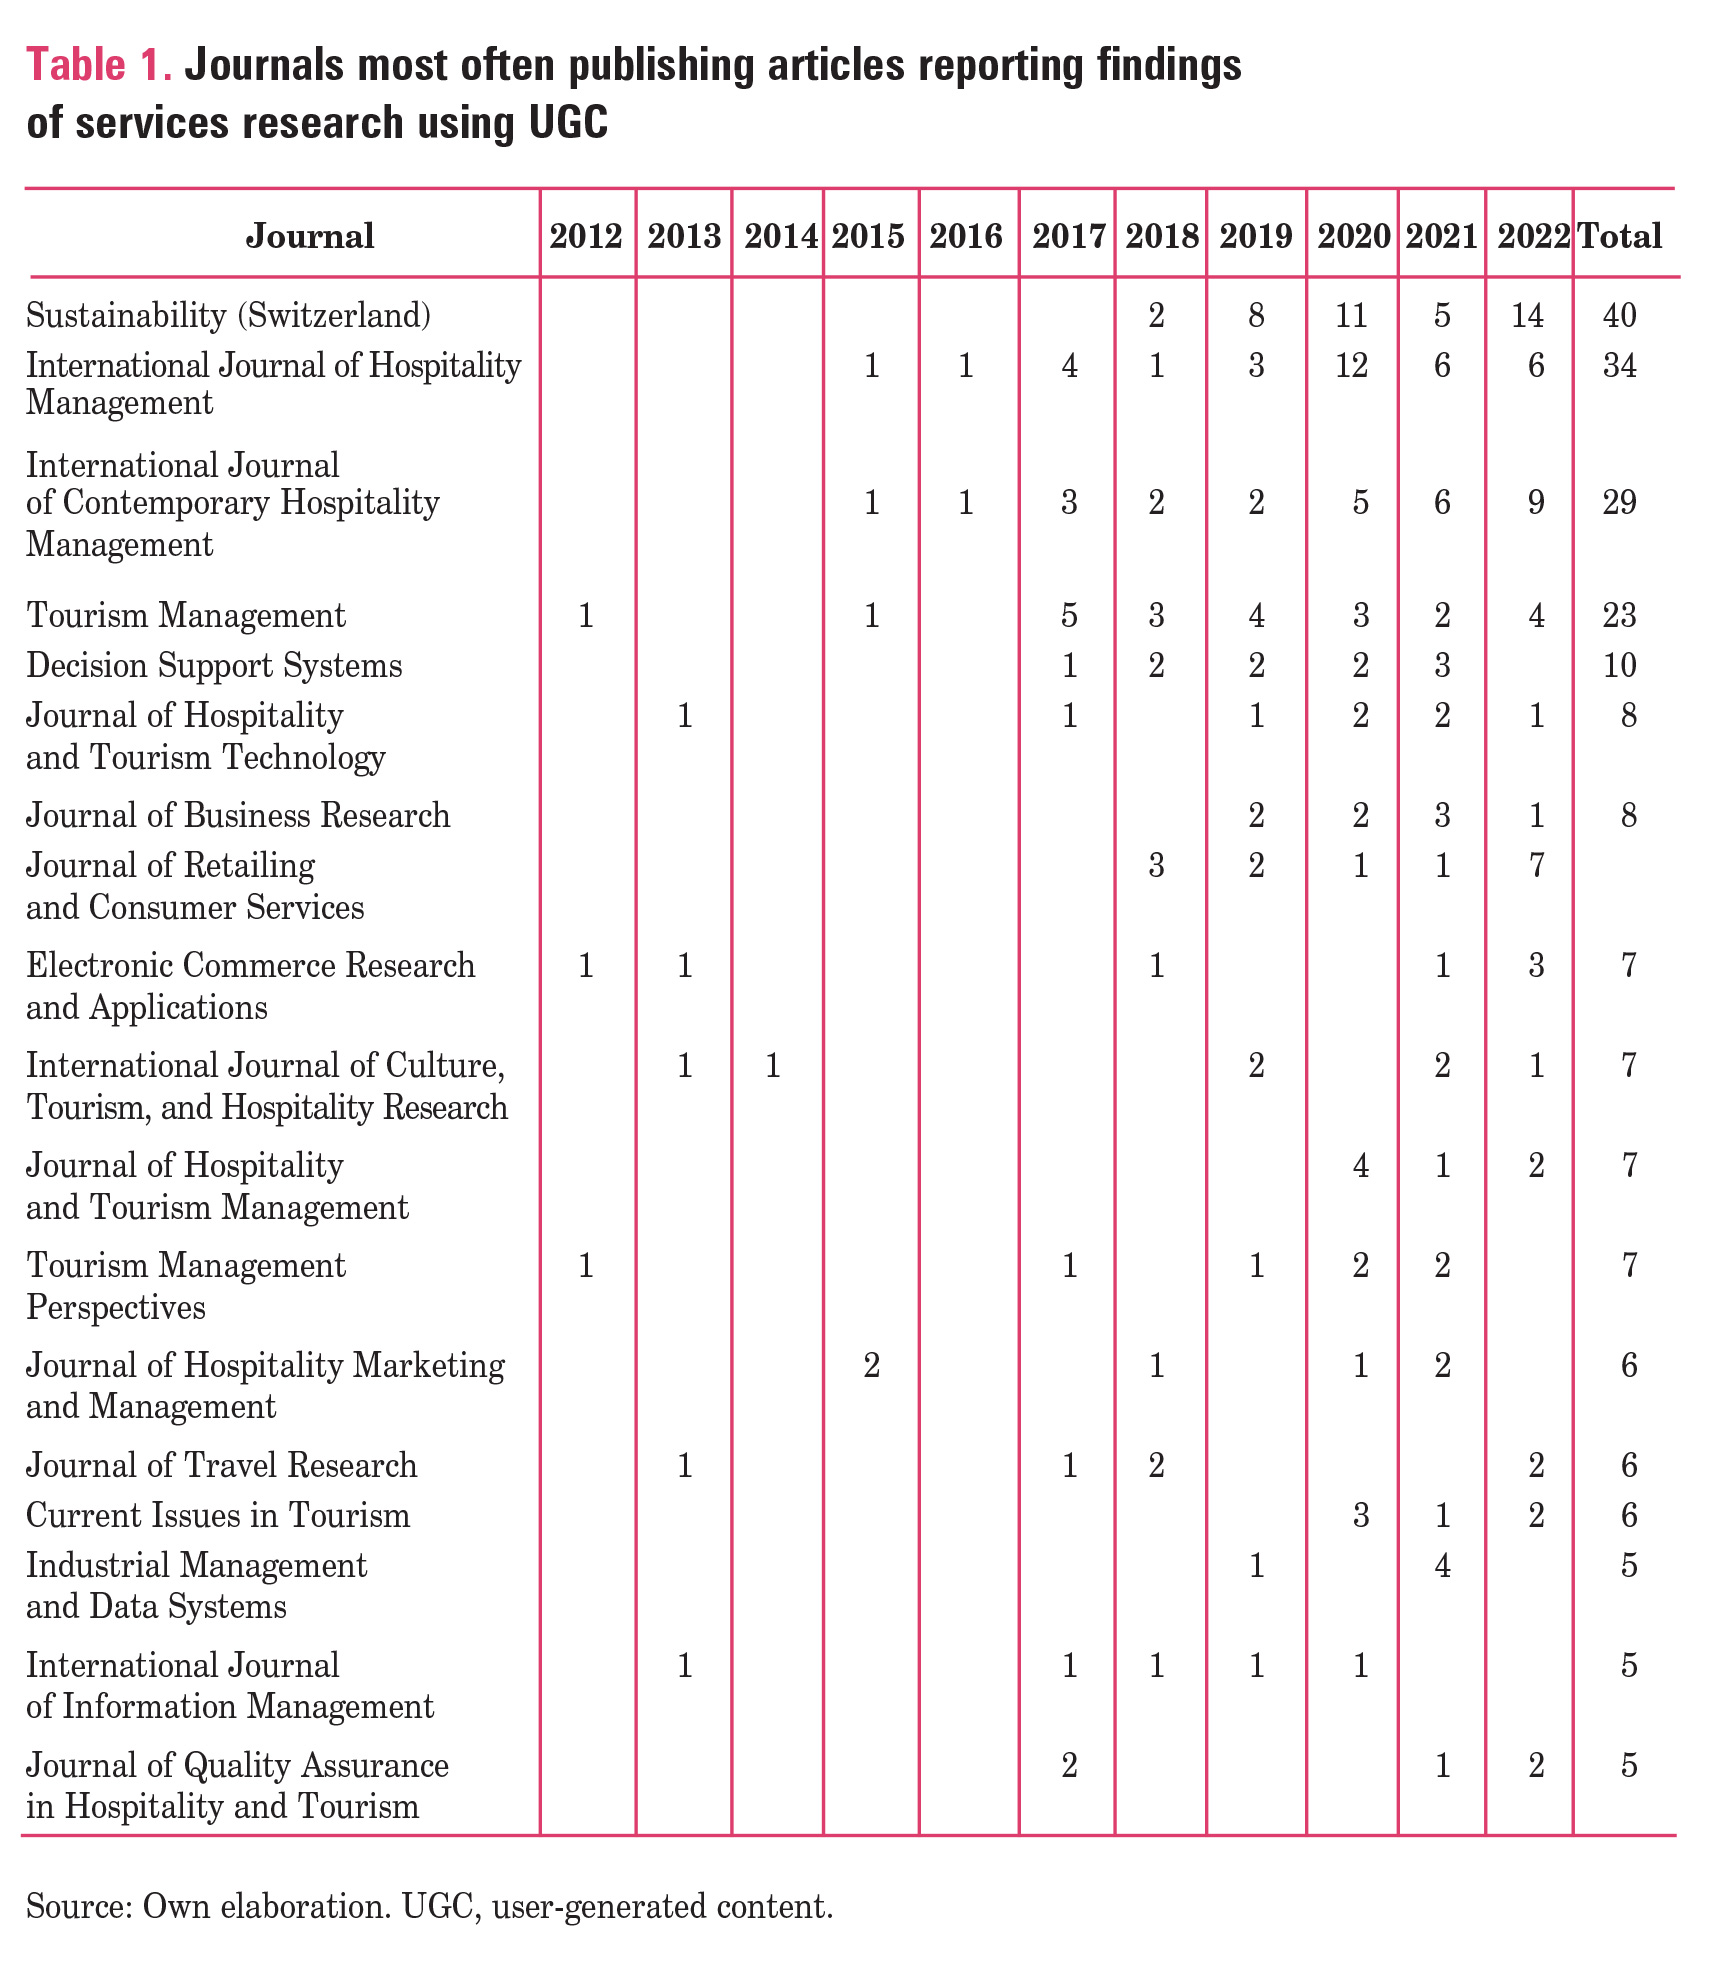
As for the place of publication, most journals published a maximum of a few articles presenting the use of UGC in service research. Nonetheless, a few journals with a few dozen papers published can be identified. The most articles were found in Sustainability (Switzerland), followed by the International Journal of Hospitality Management and the International Journal of Contemporary Hospitality Management. The list of journals in which publications on research in the service sector using UGC have appeared a minimum of five times is presented in Table 1. In addition, the years in which the articles were published are indicated.
Authors and affiliations
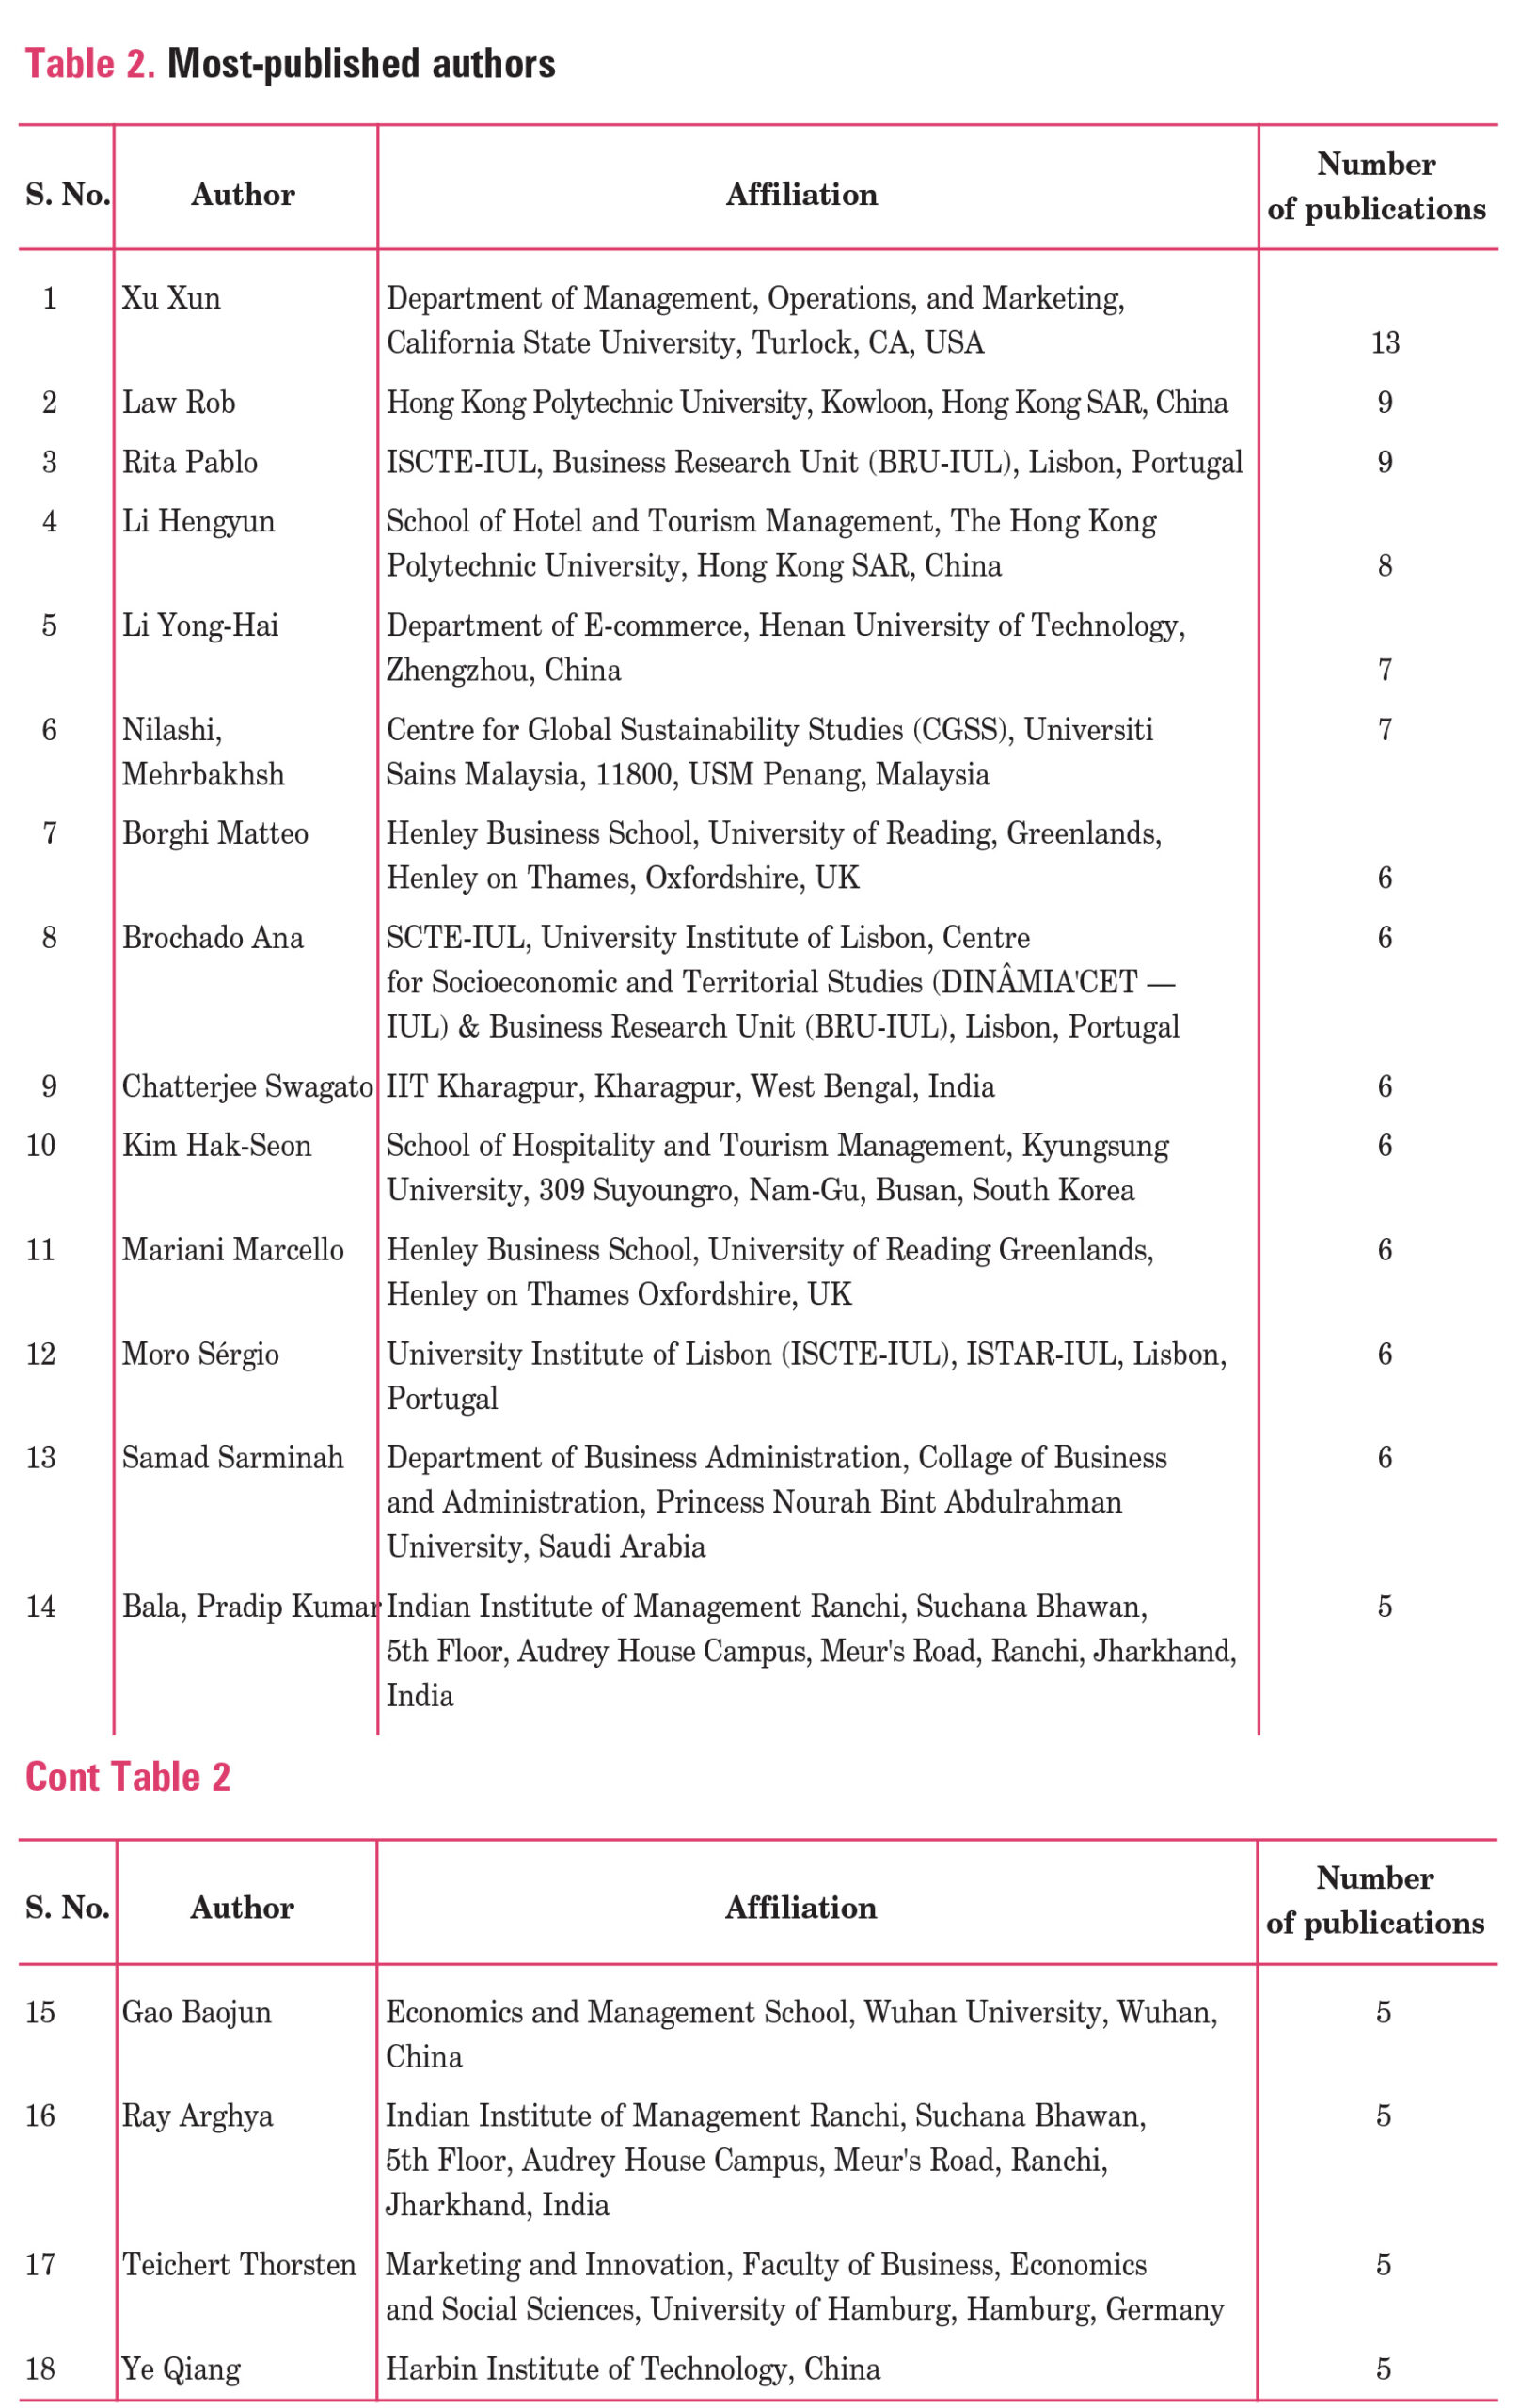
In total, there were 1,038 different authors represented in the data sample of articles. The most effective scholars are listed in Table 2; each of them has published at least five papers.
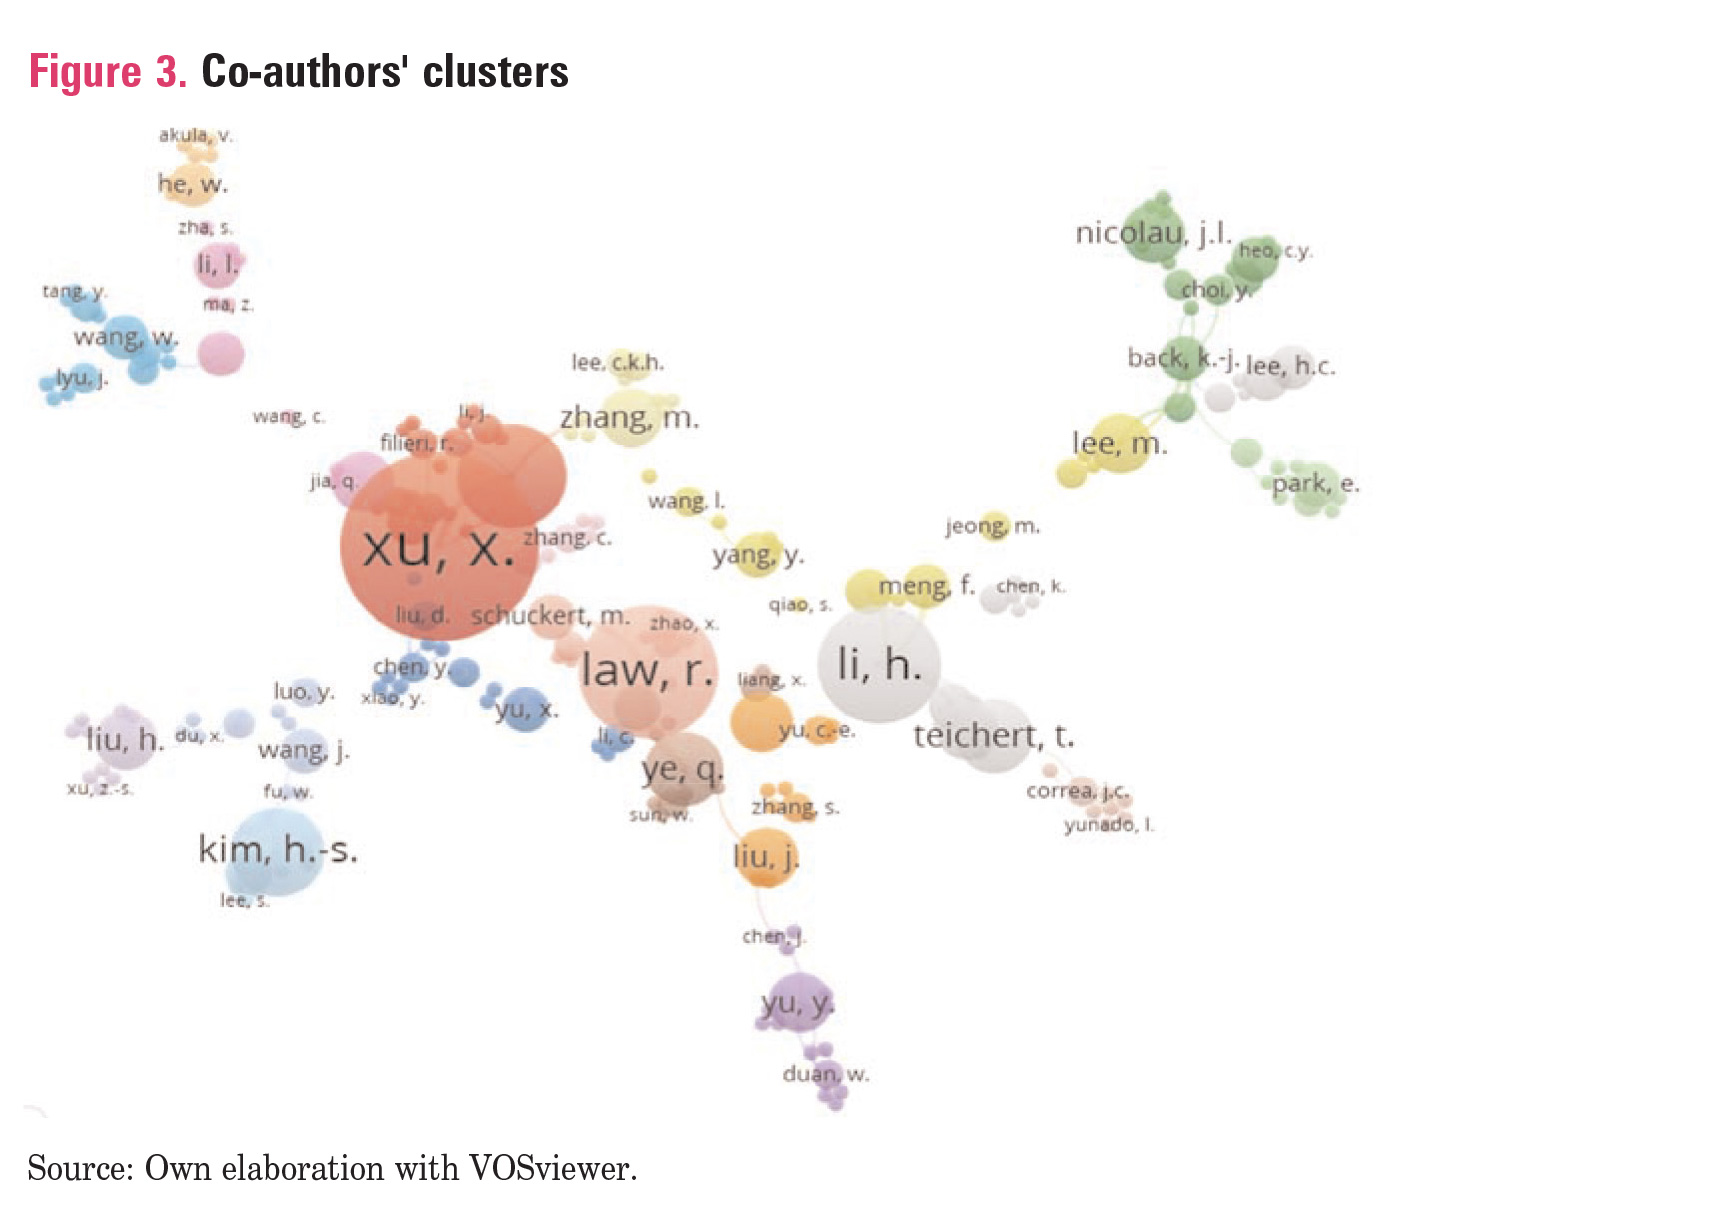
Most of the publications were prepared in teams. The network of coauthors is presented below. As may be observed, the authors who published the most frequently are also among those who cooperated with other authors very often.
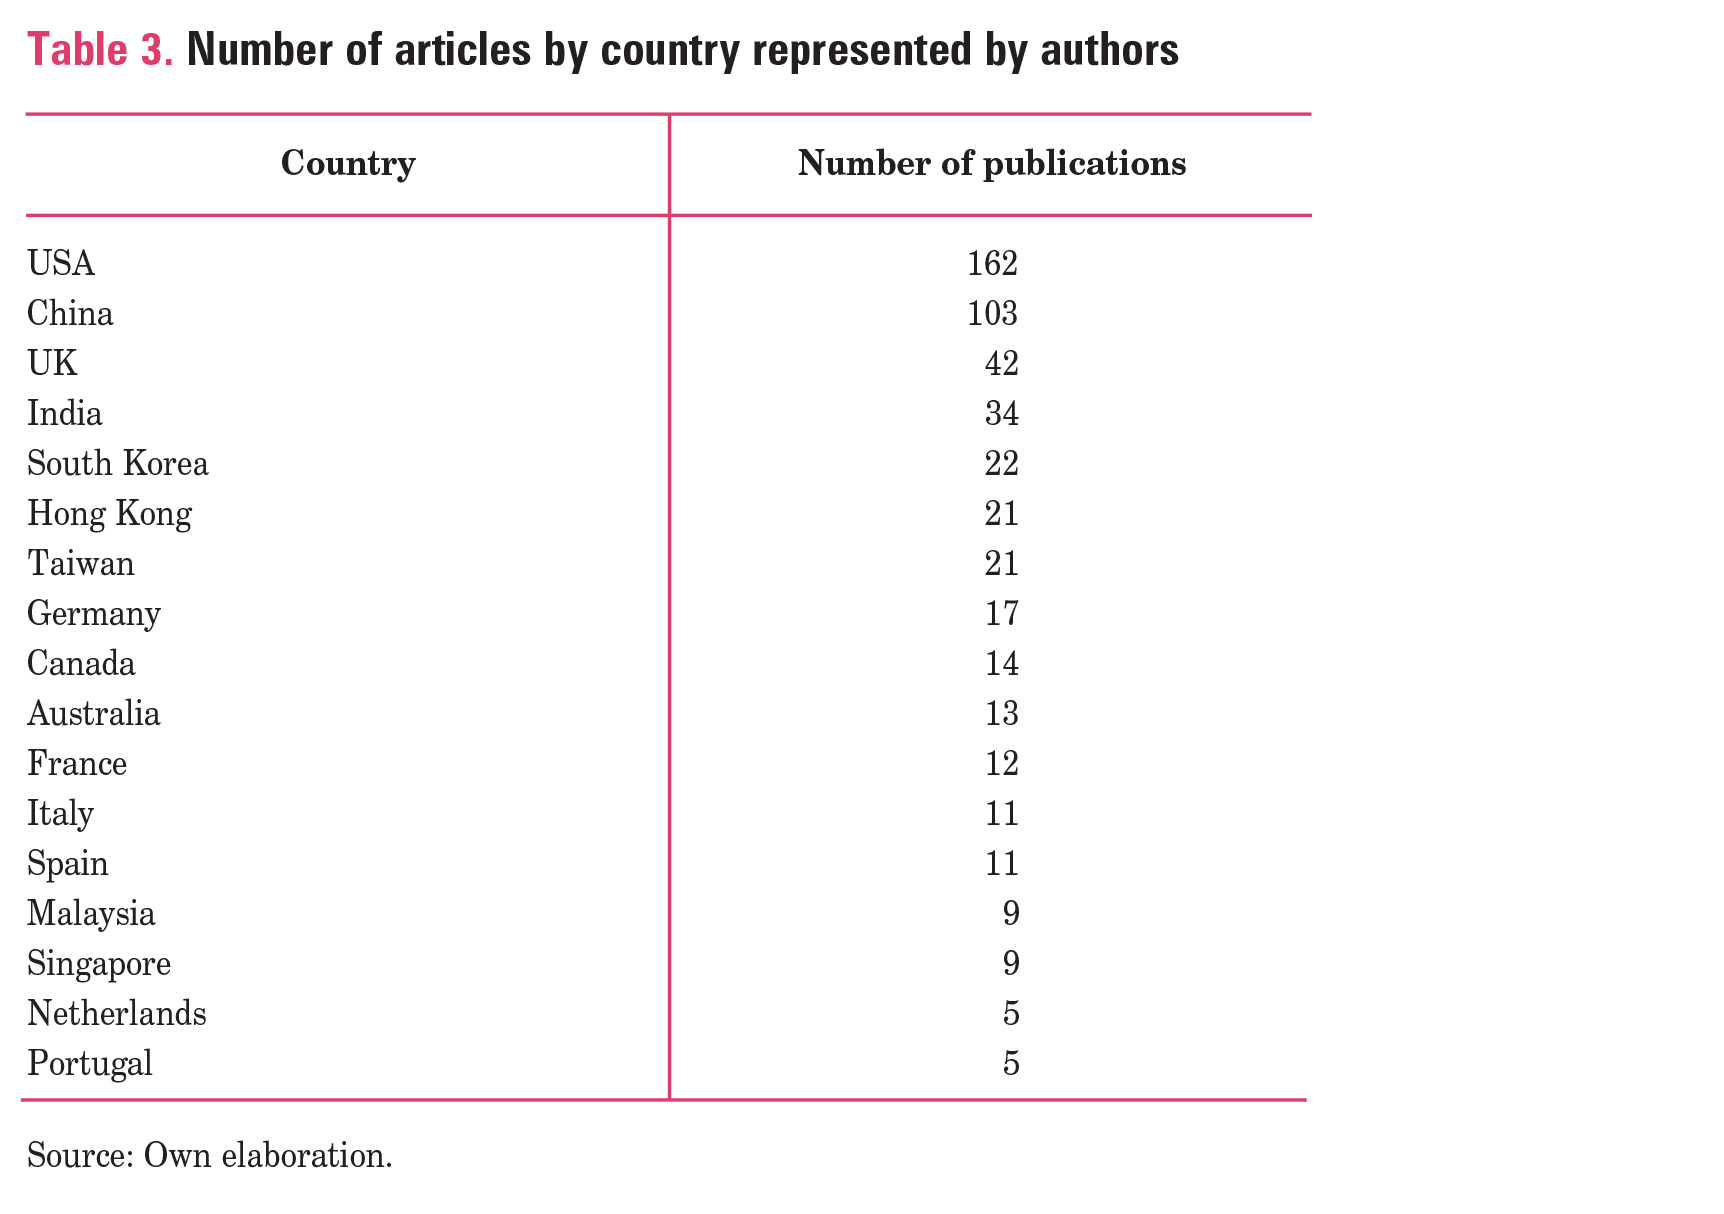
According to the findings of the analysis of the authors’ affiliations, the vast majority of the papers were associated with academics from either the USA (162) or China (103). Table 3 presents the total number of papers classified according to the authors’ country of affiliation. Owing to the limitations inherent in the present research, only countries with at least five manuscripts have been listed.
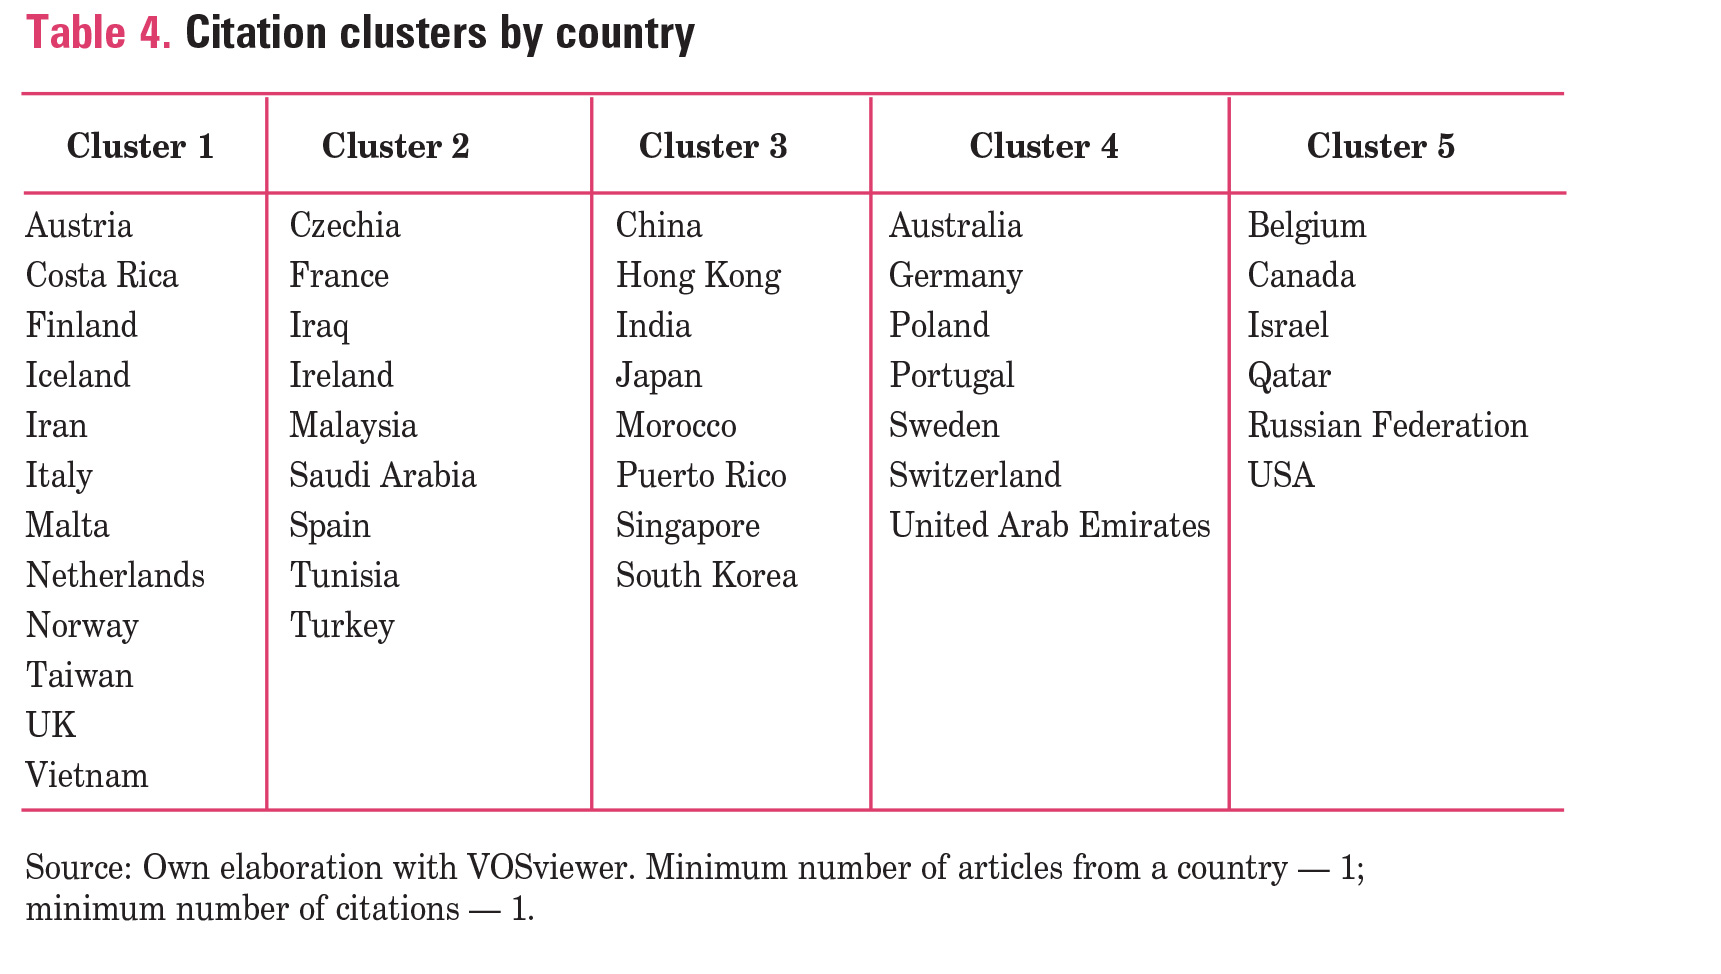
In the next stage, the analysis of citations between articles by authors with affiliations from various countries was performed. The following summary (Table 4) presents the clusters extracted based on citations. Looking at Clusters 3 and 4, it can be observed that citations are mainly concentrated in articles from the same geographical regions (Asia and Europe). In other clusters that rule cannot be observed; and so, the authors probably concentrated mainly on the field of the research, for example, analysed industry or the methods that were used and described in the articles.
Analysed services industries and data sources
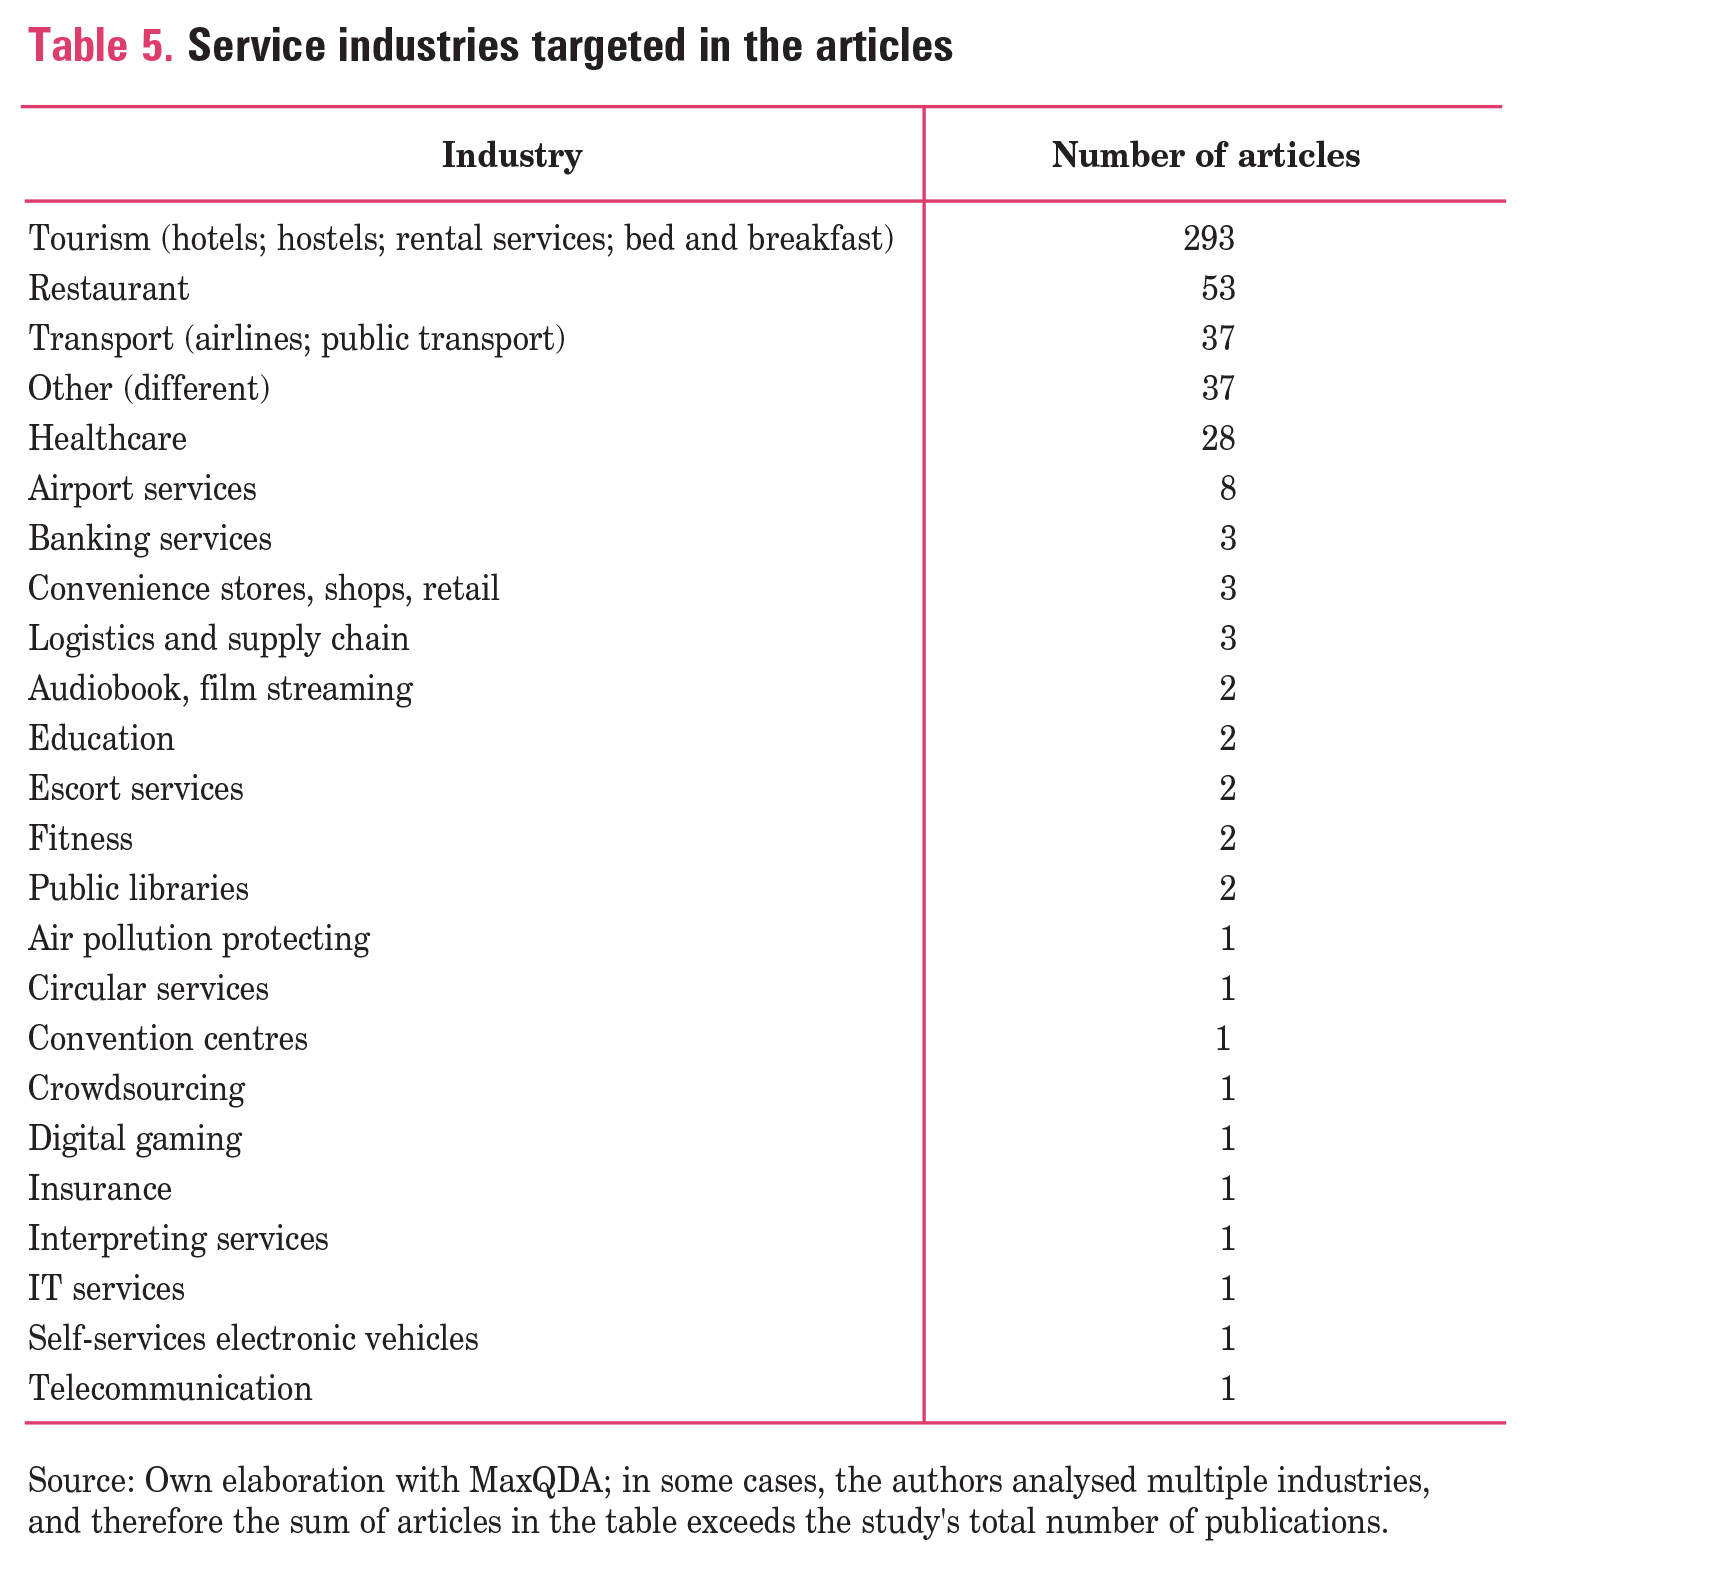
One of the research questions, set at the beginning, concerned the industry that was the field of the authors’ interest. Every article under analysis was screened and coded, which made it possible to list the services industries that the articles focussed on. Table 5 presents the findings.
As can be observed, the overwhelming number of publications addressed the tourism industries, particularly focussing on the accommodation services, and also the rental services. Quite a number of articles also concerned the gastronomic services, transportation services and health care. It should be noted that only articles that refer to studies in which the authors used UGC to evaluate the service provider, services’ customer attitudes towards them were included in the analysis. However, articles in which only products (especially tangible goods) offered by service companies had been evaluated were excluded. For example, analyses pertaining to ratings of products posted on marketplaces (e.g. Amazon) were not considered. For this reason, the sample did not include several articles pertaining to the evaluation of movies or music offered on streaming platforms.
The distribution of the studied industries largely determined the use of information sources. The vast majority of the research utilised data from platforms enabling the publication of ratings and opinions regarding travel and hospitality services. The most frequently used platform was TripAdvisor (80). The other tourist platforms used in the research were Yelp (23), Airbnb (20), Booking.com (12), Ctrip (7), Expedia (2), Google Travel (2), Tuniu (1), Trivago (1) and Trustpilot (1). The authors also quite often used data from Amazon (35) to observe customer behaviour on the platform. As for the most popular worldwide SM services, the following were the corresponding usage frequencies — Facebook was used 11 times, Twitter 14 times, YouTube 3 times and Instagram and Weibo only once each. The authors also used data from Google Maps (7), Flickr (4), Coursera (3) and Uber (2). Individual pages and platforms of the service providers were also used as a source of information.
It should be emphasised that SM platforms (such as Facebook, Twitter and Instagram) discussing general topics, not being dedicated to the specific industry, are less useful for acquiring the big sets of data. That is why, most often, only the brand’s fun pages were analysed. The goal of the research in that case was usually service quality or brand image assessment of the individual company or the group of companies (e.g. He et al., 2013).
Methods used in data analysis
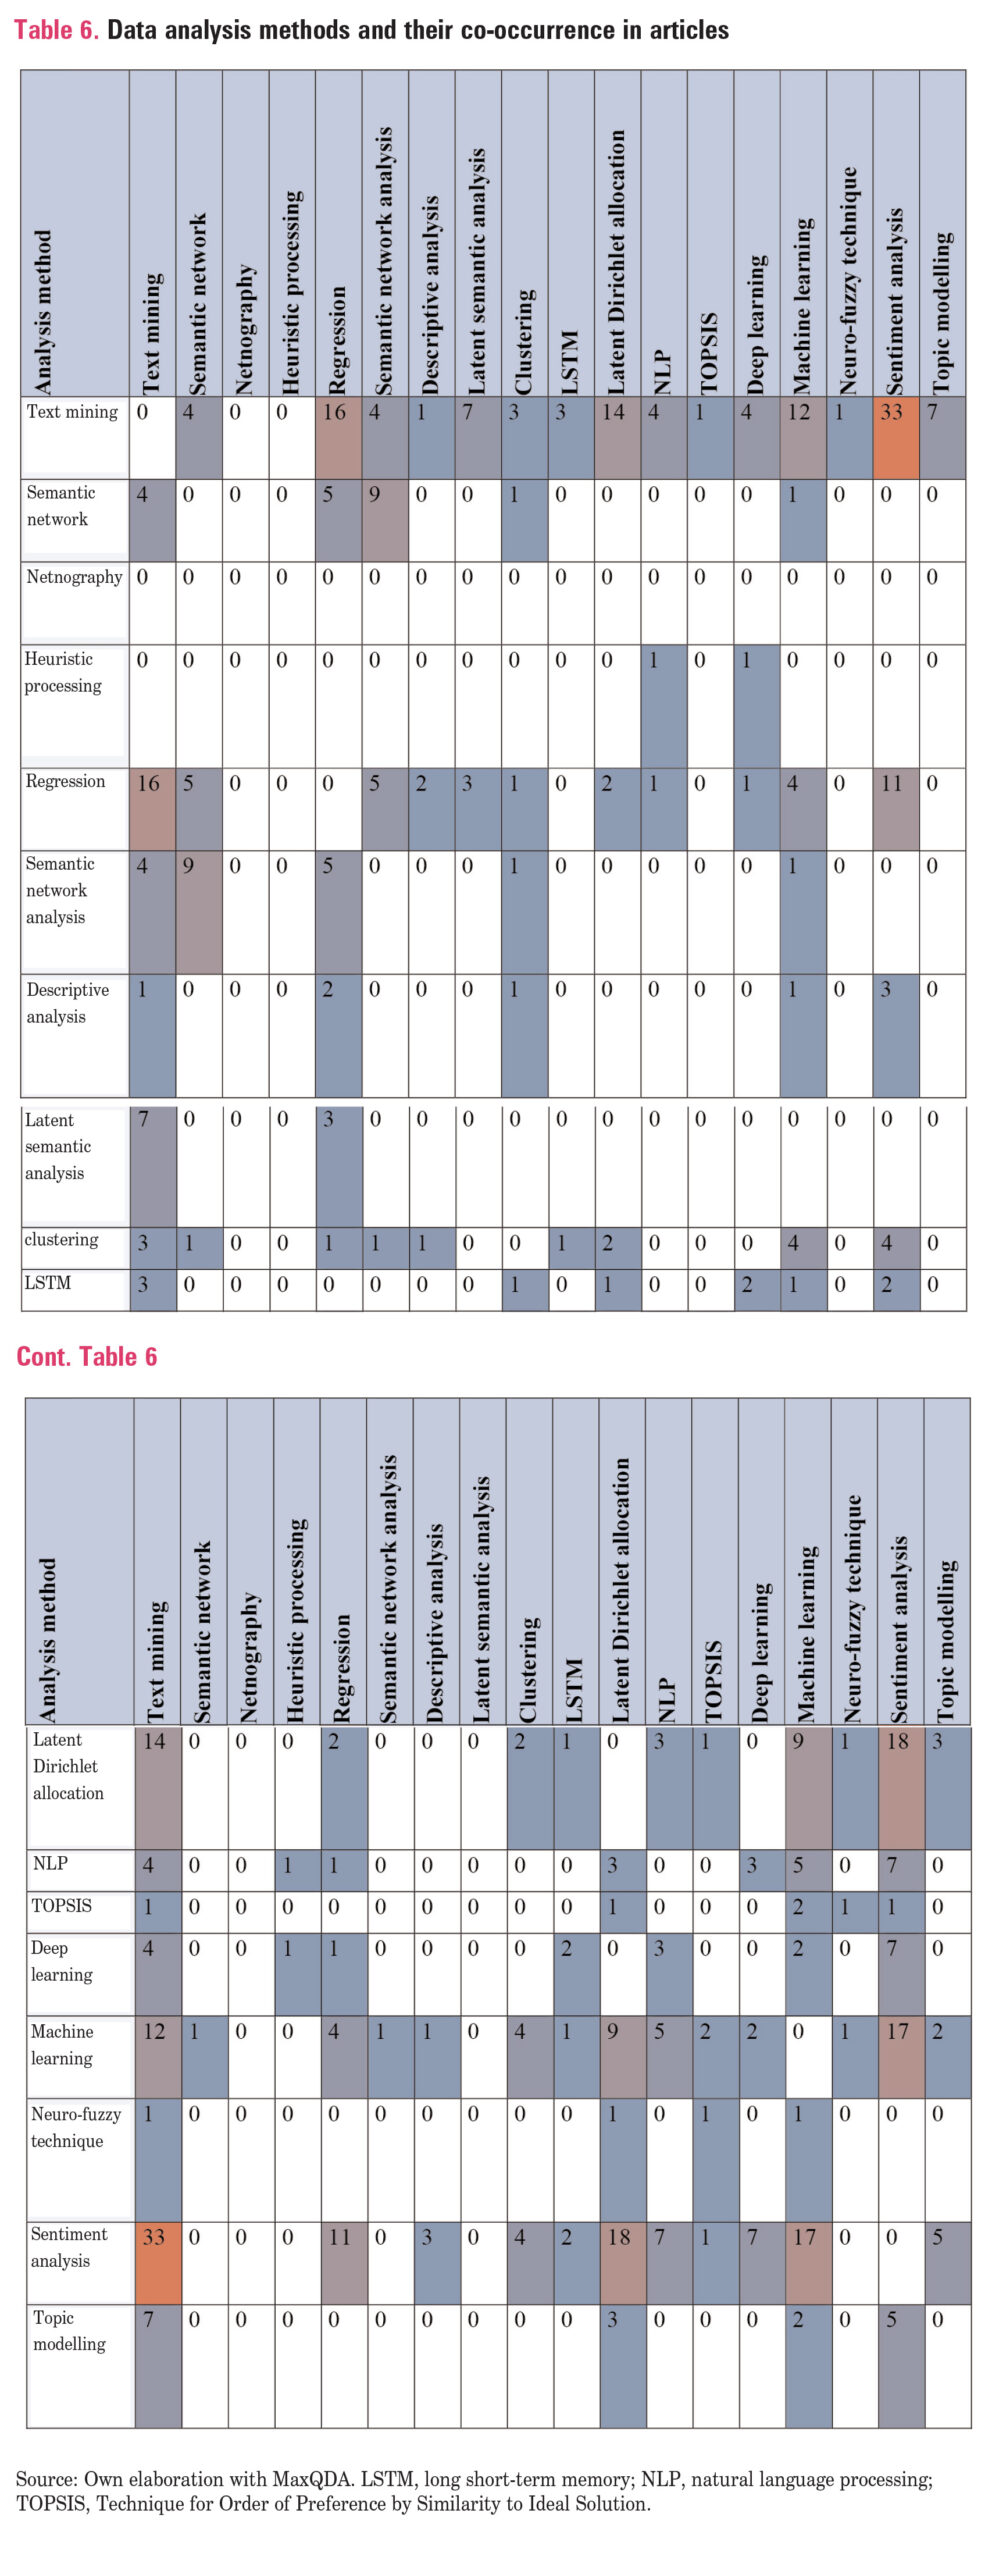
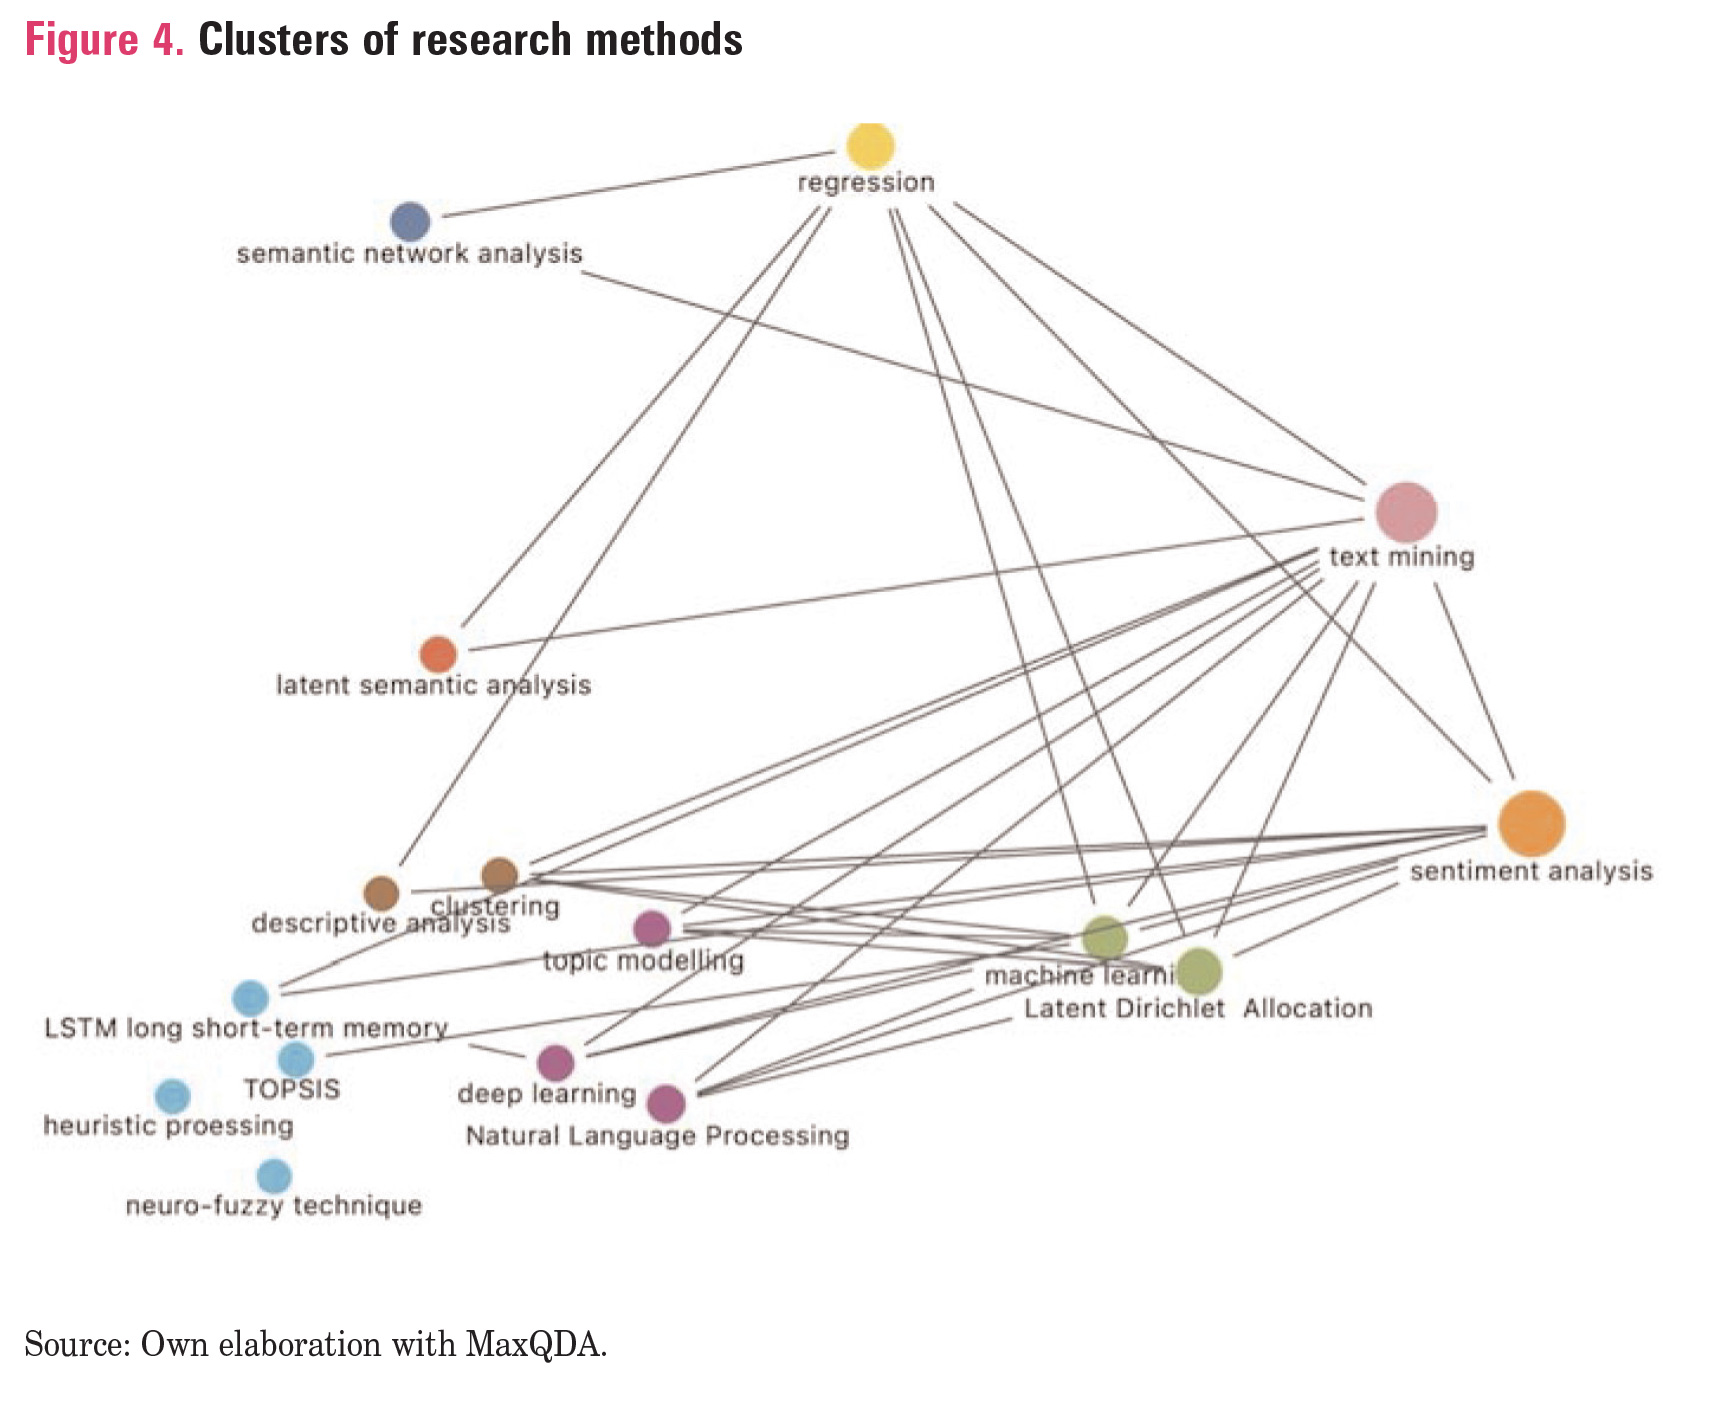
The growth of research using UGC has also led to a searching for new and more efficient methods of analysing data sets acquired from the web, which are often rapidly growing in size. Traditional methods of content analysis, even using computer assisted qualitative data analysis software (CAQDAS) are proving to be too time and cost consuming. Moreover, they fail to extract all the content relevant to answering the research questions posed by the researchers. Researchers who published their work in earlier years tended to provide a simple analysis. Some focussed only on the descriptive statistics and did not dig into the content of the opinions themselves (Racherla & Friske, 2012). Some concentrated more on the content analysis but without the support of computer techniques (Barreda & Bilgihan, 2013; Sreenivasan et al., 2012). In the following years, it can be observed that there was a greater interest among authors in extended text analysis techniques using supervised or unsupervised machine learning allowing the analysis of large data sets. Analysis of articles from the Scopus database indicates widespread implementation of text mining in research using UGC. Authors often choose to combine different methods in their research, as is presented in Table 6 and for better illustration in the following visualisation. Currently, the most commonly used data analysis methods should be associated with quantitative rather than qualitative methods. However, some authors use a mixed methods approach (both qualitative and quantitative) (Liu et al., 2021; Mejia et al., 2021; Naeem et al., 2022).
Key words co-occurrence — main topic recognition
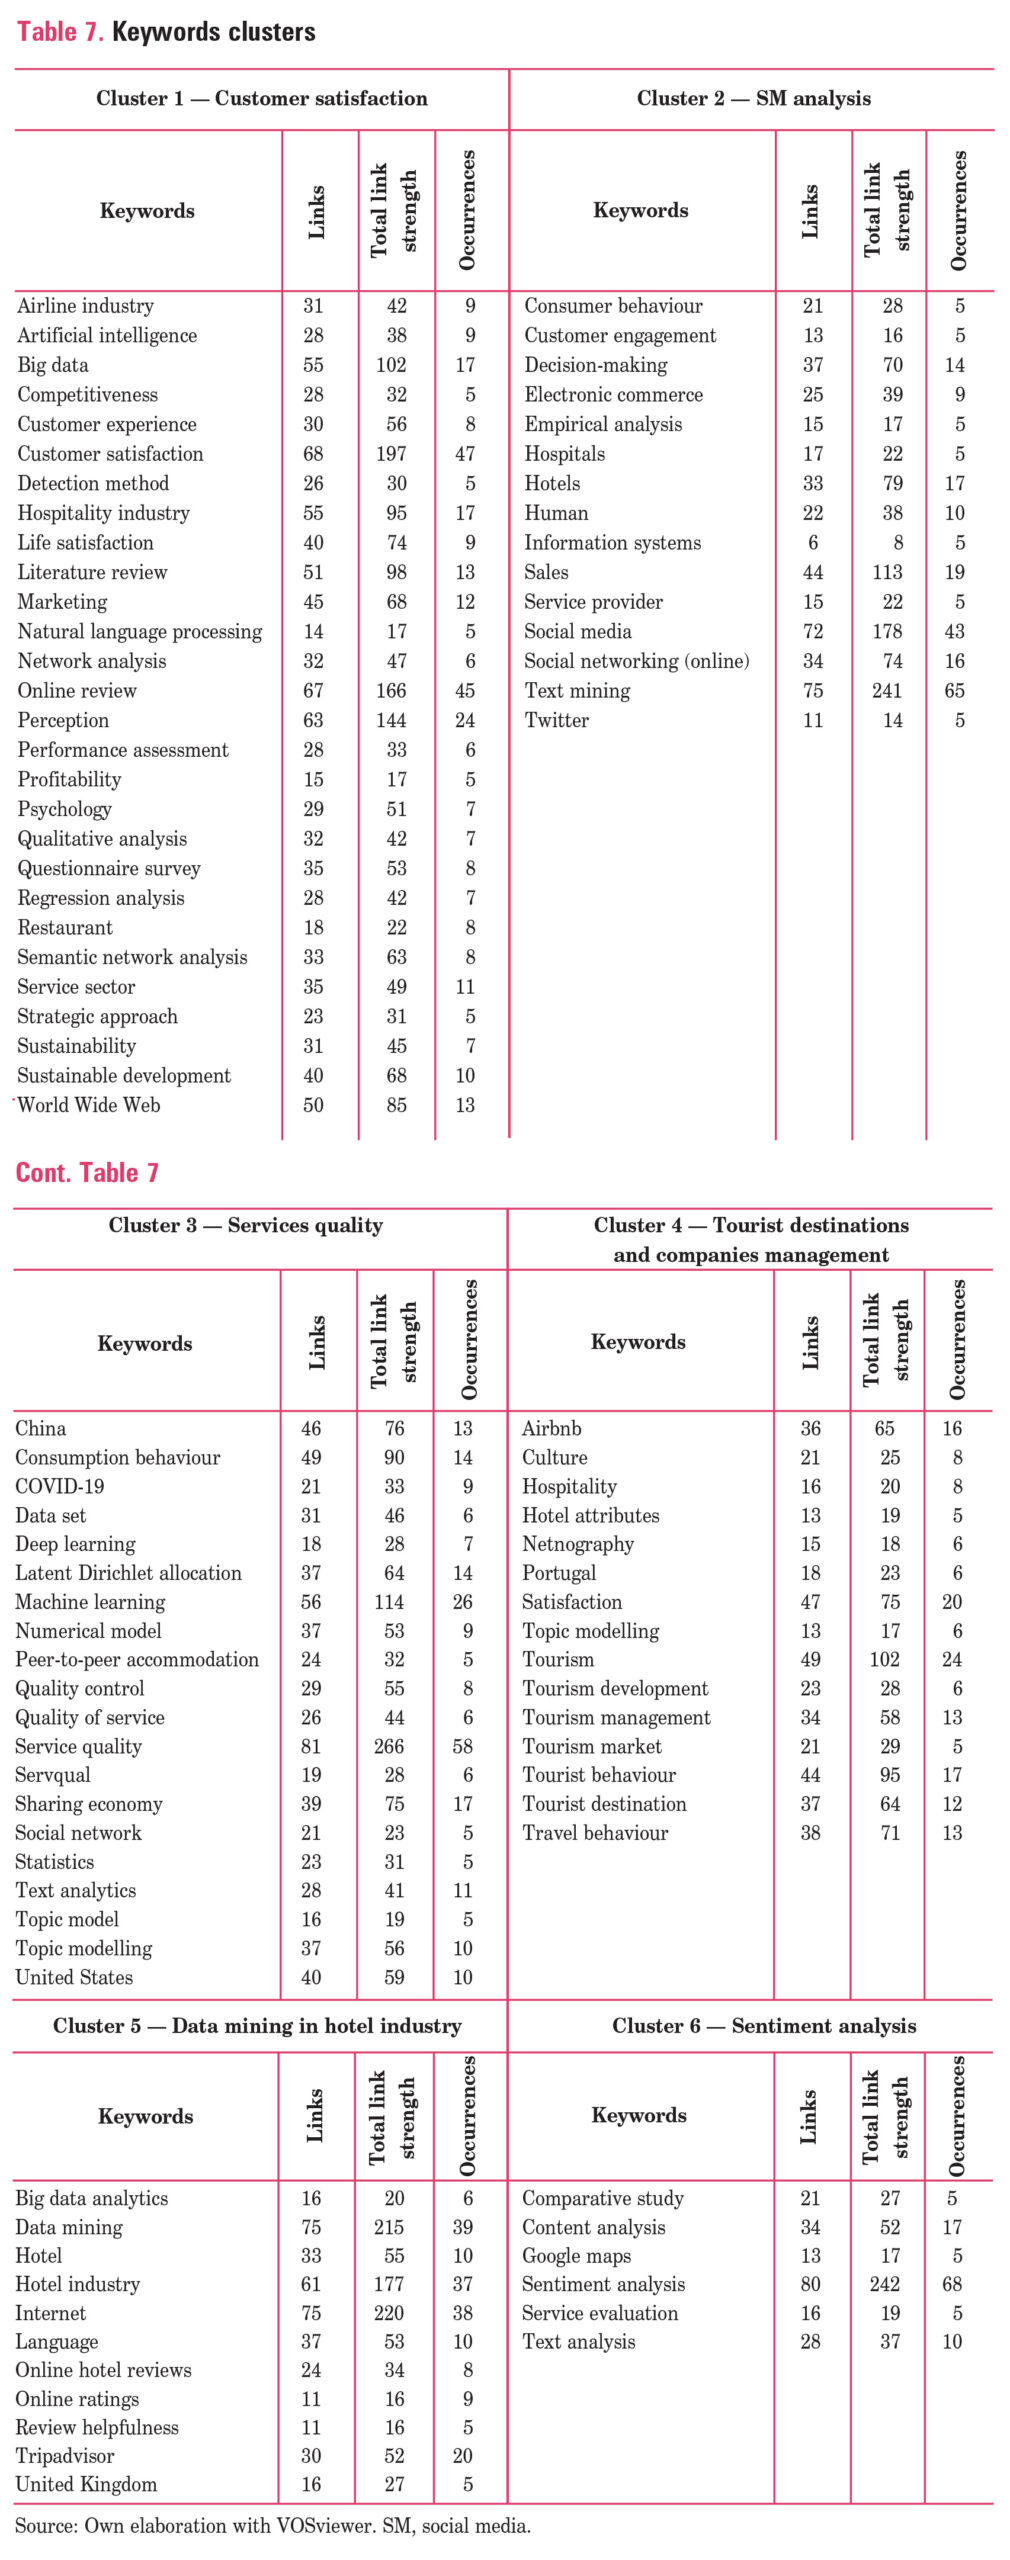
An analysis of the keywords co-occurrence was performed to investigate the main topics mentioned by authors and analyse the relationships between the articles. In the total sample of articles (433), 1,972 keywords were found, and 106 of them exceeded a minimum number of occurrences at Level 5. As a result, as shown in Figure 5, six major clusters have been extracted from the data sample. Each of them holds articles that cover similar common topics.

In the next step, the keywords frequencies in the clusters were analysed to determine the topic coverage most relevant for each cluster. Considering that all articles were based on UGC, the keyword ‘online reviews’, also appearing in the singular form, as well as ‘WOM’ and ‘word of mouth’ also with the prefix ‘e’, were not included in the process of determining the main topic. The frequencies of the keywords occurrence were analysed; also, the logical explanation of the links between the words grouped in the cluster was derived. The extracted topics are as follows: customers satisfaction, social media analysis, services quality, tourist destinations and companies management, data mining in hotel industry and sentiment analysis. The conclusion of the analysis is presented in Table 7.
Main topic analysis
Cluster 1
— Customer satisfaction
The authors concentrate primarily on learning more about the determinants of customer satisfaction of service companies, especially the airline and hospitality companies also those offering services with the artificial intelligence elements (e.g. robots in restaurants). The performance assessment confirmed that concentration on customer experience and customer satisfaction improvement can affect the competitiveness and profitability of the service provider. The authors also noted the importance of the sustainable approach of services companies, which was discussed by customers. The researchers used big data samples, which were mainly analysed by using the following methods: natural language processing (NLP), semantic network analysis, detection method and regression analysis, as well as qualitative analysis (Ban et al., 2019; Ban & Kim, 2019; Bhattacharyya & Dash, 2021; Borghi & Mariani, 2021; Chen et al., 2019; Cherapanukorn & Sugunnasil, 2022; Fu et al., 2022; Gao et al., 2018; Hu et al., 2019; Huang et al., 2021; Kaya, 2018; Kostromitina et al., 2021; Lee et al., 2020; Lin et al., 2018; Liu et al., 2013, 2017, 2021a,b; Lynn & Kwortnik, 2020; Nilashi et al., 2021, 2022; Rasool & Pathania, 2021; Sezgen et al., 2019; Shadiyar et al., 2020; Shin & Nicolau, 2022; Song et al., 2022; Sudhakar & Gunasekar, 2020; Teichert et al., 2020; Terziyska, 2021; Xu & Li, 2016; Yu et al., 2022a,b; Zibarzani et al., 2022).
Cluster 2
— SM analysis
The authors explored the issue of UGC and eWOM in SM platforms. They focussed on several important aspects: the impact of SM on consumer behaviour and decision-making, and consequently on the purchase of services.
They also analysed the aspect of consumer involvement in obtaining and sharing information. The main platform used was Twitter. The analysis was concentrated mainly on the services of hotels and hospitals, and the authors most often used the text mining method (Cox, 2015; Drevs & Hinz, 2014; Duan et al., 2016; Eslami et al., 2018; Gao et al., 2015; He et al., 2013; Huang et al., 2017; Hyman et al., 2022; Khurana et al., 2019; Kim et al., 2016; Liu et al., 2017; Lockie et al., 2015; Shen et al., 2020; Sreenivasan et al., 2012; Viswanathan et al., 2018).
Cluster 3
— Services quality
The authors looked at factors related to service quality and quality control. Focussing specifically on peer-to-peer accommodation services, they highlighted the determinants of quality by relating them to the framework defined by the SERVQUAL method (a quality measurement method; a detailed description can be accessed in the study of Parasuraman et al., 1988. They also referred to the impact of quality on customer behaviour. Attention was also focussed on the role of quality management in the context of the COVID-19 pandemic threats. The most-often mentioned analysis methods were deep learning, latent Dirichlet allocation, machine learning, text analytics and topic modelling. The studies were mainly concentrated in China and the USA (Barravecchia et al., 2020; Brett, 2019; Ding et al., 2020; Gunasekar et al., 2021; Lim & Lee, 2020; Lin et al., 2022; Liu & Chen, 2022; Mejia et al., 2021; Palese & Usai, 2018; Stepaniuk, 2016; Wong et al., 2022; Ye et al., 2019; Zuo et al., 2022).
Cluster 4 — Tourist destinations
and companies management
The authors analysed which factors have the greatest impact on tourists’ satisfaction and behaviour and what is considered when evaluating tourist destinations and businesses. Awareness and knowledge of these factors is crucial in planning the development and management of both destinations and tourism businesses. The authors used topic modelling and netnography techniques to analyse the data (Aggarwal & Gour, 2020; Dias et al., 2014; Guo et al., 2015; Henrique de Souza et al., 2020; Hu et al., 2019; Jin et al., 2018; Jin & Xu, 2020; Kim et al., 2017; Lamb et al., 2020; Lu & Stepchenkova, 2012; Medina et al., 2016; Mkono, 2013; Pjero & Gjermëni, 2020; Shang & Luo, 2022; Sthapit & Björk, 2020; Terziyska, 2021; Tontini et al., 2017; Veríssimo & Costa, 2018; Xie et al., 2017).
Cluster 5
— Data mining in hotel industry
The authors focus on the helpfulness of online ratings and reviews in hotel industry. They concentrate on methodological aspects of big data analysis, especially with data mining techniques (Barreda & Bilgihan, 2013; Chen et al., 2019; Ghose et al., 2012; Guo et al., 2017; Lee et al., 2020; Liu et al., 2013, 2017; Nilashi et al., 2021; Ranjbari et al., 2020; Schuckert et al., 2015).
Cluster 6
— Sentiment analysis
The largest proportion of authors, who used UGC in their research, decided to conduct sentiment analysis. This is the type of content analysis that involves deployment of the NLP technique, which determines if the data in the text (mainly those data elements that are constituted in the form of words) are positive, negative or neutral. The authors used data from web mapping platforms such as Google Maps to evaluate services (Alamoudi & Alghamdi, 2021; AlSurayyi et al., 2019; Eletter, 2020; Hu et al., 2020; Khan & Loan, 2022; Li et al., 2022; Luo et al., 2021a,b; Mathayomchan & Taecharungroj, 2020; Mittal & Agrawal, 2022; Park et al., 2020; Rasool & Pathania, 2021; Witherspoon & Stone, 2013; Yu & Zhang, 2020; Yu et al., 2022a,b; Zhang et al., 2021). The authors grouped in the last two described clusters focussed heavily on methodological issues deepening the understanding of the use of big data and presenting techniques to analyse them. In contrast, three other clusters (1, 3 and 4), focussed on in-depth examination of selected aspects of marketing and management use of UGC (service management, customer satisfaction and quality management). Cluster 2 focussed more on the place where UGC is published — SM. The analysis allows the conclusion to be reached that a certain limitation characterises the addressed topics. For example, the issue of reactions to negative comments, often analysed by authors in experimental or survey research (Liao et al., 2021), has not been heavily explored by researchers using UGC. The topic of factors influencing customer dissatisfaction has also been addressed relatively seldom.
Conclusion
The purpose of this paper is to report the results of a bibliometric study that was conducted in order to analyse the field of utilisation of UGC as data for the research on services. The findings of the investigation demonstrated that there has been a significant increase in the total number of publications that are related to that subject, especially in the last 3 years. The recognised tendency is the effect of the expansion of Internet technologies and SM, which have impacted the development of UGC. Many academics regard published content as a reliable and valuable source of information due to its wide availability and diversity.
An examination of the methods used by the researchers reveals that they have been still improved and new methods are constantly being developed. It should also be emphasised that more sophisticated machine learning algorithms are implemented for text analysis. In the analysed dataset of articles, many authors indicated affiliations with technical universities. Therefore, it can be assumed that the abovementioned trend will continue, especially considering the geometrical growth of Internet content and the ever-increasing datasets to be analysed.
The authors, in their research, have mainly focussed on the tourism and hospitality industries. Little attention was given to other industries. Therefore, it would be advisable to undertake analyses pertaining to them in the future.
The keywords co-occurrence analysis made it possible to identify the main themes of the research. These are: customer satisfaction, SM analysis, services quality, tourist destination and company management, data mining in hotel industry and sentiment analysis.
This list of topics does not exhaust the potential of the data from UGC. Considering the spontaneous nature of the opinions and the natural way of formulating their content, it is worth considering, for example, the use of UGC in constructing measurement scales for reliable questionnaire research. This is because users’ statements can provide a basis for the better operationalisation of constructs.
Among future research topics, it is also advisable to consider the analysis of reactions to negative comments. Yet, in addition to analysing the text posted online, it is also worth examining the broader context of the statement and considering such data as the time of publication, the people accompanying the consumption of the service (individual vs group consumption), whether the statement is spontaneous or triggered by the company’s actions (e.g. an inquiry or a contest) and the place of the review (third party platform or the evaluated company’s own website or SM page/profile).
The research also has limitations. First, the set of analysed articles is limited only to those published in journals indexed in the Scopus database between 2012 and 2022. In addition, the query used keywords and additional exclusions, which also limited the study sample. Introducing other keywords and expanding or reducing the list of exclusions would have affected the scope of the study.
This study has theoretical implications. Future researchers can benefit from the analyses carried out via literature reviews. Not only has the importance of the topic been demonstrated but also the main themes addressed by the authors have been identified, indicating limitations that can serve as a basis for identification of a gap that can be addressed in further research.
The article is also useful for practitioners because it presents some patterns in current research, particularly topics and methods useful also in potential practical analysis.

References
1. Aggarwal, S., & Gour, A. (2020). Peeking inside the minds of tourists using a novel web analytics approach. Journal of Hospitality and Tourism Management, 45, 580–591. Scopus. https://doi.org/10.1016/j.jhtm.2020.10.009
2. Alamoudi, E. S., & Alghamdi, N. S. (2021). Sentiment classification and aspect-based sentiment analysis on yelp reviews using deep learning and word embeddings. Journal of Decision Systems, 30(2–3), 259–281. Scopus. https://doi.org/10.1080/12460125. 2020.1864106
3. AlSurayyi, W. I., Alghamdi, N. S., & Abraham, A. (2019). Deep learning with word embedding modeling for a sentiment analysis of online reviews. International Journal of Computer Information Systems and Industrial Management Applications, 11, 227–241. Scopus. https://www.scopus.com/inward/record.uri?eid=2-s2.0-85081244645&partnerID =40&md5=9d351a0adc1146e0e37bfeb4ae4949f6
4. Babić Rosario, A., Sotgiu, F., De Valck, K., & Bijmolt, T. H. A. (2016). The effect of electronic word of mouth on sales: A meta-analytic review of platform, product, and metric factors. Journal of Marketing Research, 53(3), 297–318. https://doi.org/ 10.1509/jmr.14.0380
5. Ban, H.-J., Choi, H., Choi, E.-K., Lee, S., & Kim, H.-S. (2019). Investigating key attributes in experience and satisfaction of hotel customer using online review data. Sustainability (Switzerland), 11(23). Scopus. https://doi.org/10.3390/su11236570
6. Ban, H.-J., & Kim, H.-S. (2019). Understanding customer experience and satisfaction through airline passengers’ online review. Sustainability (Switzerland), 11(15). Scopus. https://doi.org/10.3390/su11154066
7. Barravecchia, F., Mastrogiacomo, L., & Fiorenzo, F. (2020). Categorizing quality determinants in mining user-generated contents. Sustainability (Switzerland), 12(23), 1–12. Scopus. https://doi.org/10.3390/su12239944
8. Barreda, A., & Bilgihan, A. (2013). An analysis of user-generated content for hotel experiences. Journal of Hospitality and Tourism Technology, 4(3), 263–280. Scopus. https://doi.org/10.1108/JHTT-01-2013-0001
9. Bello-Orgaz, G., Jung, J. J., & Camacho, D. (2016). Social big data: Recent achievements and new challenges. Information Fusion, 28, 45–59. https://doi.org/10.1016/ j.inffus.2015.08.005
10. Bhattacharyya, J., & Dash, M. K. (2021). Investigation of customer churn insights and intelligence from social media: A netnographic research. Online Information Review, 45(1), 174–206. Scopus. https://doi.org/10.1108/OIR-02-2020-0048
11. Borghi, M., & Mariani, M. M. (2021). Service robots in online reviews: Online robotic discourse. Annals of Tourism Research, 87(103036). Scopus. https://doi.org/ 10.1016/j.annals.2020.103036
12. Brett, M. R. (2019). Customer service dimensions in state and private game reserves in northern KwaZulu-Natal, South Africa. African Journal of Hospitality, Tourism and Leisure, 8(3). Scopus. https://www.scopus.com/inward/record.uri?eid=2-s2.0-85067790389 &partnerID=40&md5=1acdcfb6e13b0f01b0a307fc0e4eeb67
13. Chen, M.-C., Hsiao, Y.-H., Chang, K.-C., & Lin, M.-K. (2019). Applying big data analytics to support Kansei engineering for hotel service development. Data Technologies and Applications, 53(1), 33–57. Scopus. https://doi.org/10.1108/DTA-05-2018-0048
14. Cherapanukorn, V., & Sugunnasil, P. (2022). Tourist attraction satisfaction factors from online reviews. A case study of tourist attractions in Thailand. Journal of Environmental Management and Tourism, 13(2), 379–390. Scopus. https://doi.org/10.14505/jemt.v13.2(58).08
15. Cheung, C. M. K., Lee, M. K. O., & Rabjohn, N. (2008). The impact of electronic wordofmouth: The adoption of online opinions in online customer communities. Internet Research, 18(3), 229–247. https://doi.org/10.1108/10662240810883290
16. Cortis, K., & Davis, B. (2021). Over a decade of social opinion mining: A systematic review. Artificial Intelligence Review, 54(7), 4873–4965. https://doi.org/10.1007/s10462-021-10030-2
17. Cox, C. (2015). Consumer experiences of accommodation deals purchased via social coupon promotions: An Australian perspective. Journal of Hospitality Marketing and Management, 24(6), 609–632. Scopus. https://doi.org/10.1080/19368623.2014.925842
18. Dias, J. A., Correia, A., & López, F. J. M. (2014). From information-sharing to vacation rental choices-The case of Albufeira, Portugal. International Journal of Culture, Tourism, and Hospitality Research, 8(1), 35–47. Scopus. https://doi.org/ 10.1108/IJCTHR-07-2013-0049
19. Ding, K., Choo, W. C., Ng, K. Y., & Ng, S. I. (2020). Employing structural topic modelling to explore perceived service quality attributes in Airbnb accommodation. International Journal of Hospitality Management, 91. Scopus. https://doi.org/10.1016/ j.ijhm.2020.102676
20. Donthu, N., Kumar, S., Pandey, N., Pandey, N., & Mishra, A. (2021). Mapping the electronic word-of-mouth (eWOM) research: A systematic review and bibliometric analysis. Journal of Business Research, 135, 758–773. https://doi.org/10.1016/ j.jbusres.2021.07.015
21. Drevs, F., & Hinz, V. (2014). Who chooses, who uses, who rates: The impact of agency on electronic word-of-mouth about hospitals stays. Health Care Management Review, 39(3), 223–233. Scopus. https://doi.org/10.1097/HMR.0b013e3182993b6a
22. Duan, W., Yu, Y., Cao, Q., & Levy, S. (2016). Exploring the impact of social media on hotel service performance: A sentimental analysis Approach. Cornell Hospitality Quarterly, 57(3), 282–296. Scopus. https://doi.org/10.1177/1938965515620483
23. Eletter, S. F. (2020). Sentiment analysis towards actionable intelligence via deep learning. TEM Journal, 9(4), 1663–1668. Scopus. https://doi.org/10.18421/TEM94-44
24. Eslami, S. P., Ghasemaghaei, M., & Hassanein, K. (2018). Which online reviews do consumers find most helpful? A multi-method investigation. Decision Support Systems, 113, 32–42. Scopus. https://doi.org/10.1016/j.dss.2018.06.012
25. Fu, W., Wei, S., Wang, J., & Kim, H.-S. (2022). Understanding the customer experience and satisfaction of casino hotels in busan through online user-generated content. Sustainability (Switzerland), 14(10). Scopus. https://doi.org/10.3390/su1410584616-3-4
26. Gao, G. G., Greenwood, B. N., Agarwal, R., & McCullough, J. S. (2015). VOCAL minority and silent majority: How do online ratings reflect population perceptions of quality. MIS Quarterly: Management Information Systems, 39(3), 565–589. Scopus. https://doi.org/10.25300/MISQ/2015/39.3.03
27. Gao, S., Tang, O., Wang, H., & Yin, P. (2018). Identifying competitors through comparative relation mining of online reviews in the restaurant industry. International Journal of Hospitality Management, 71, 19–32. Scopus. https://doi.org/ 10.1016/j.ijhm.2017.09.004
28. Ghose, A., Ipeirotis, P. G., & Li, B. (2012). Designing ranking systems for hotels on travel search engines by mining user-generated and crowdsourced content. Marketing Science, 31(3), 493–520. Scopus. https://doi.org/10.1287/mksc.1110.0700
29. Gunasekar, S., Kumar, D. S., Purani, K., Sudhakar, S., Dixit, S. K., & Menon, D. (2021). Understanding service quality attributes that drive user ratings: A text mining approach. Journal of Vacation Marketing, 27(4), 400–419. Scopus. https://doi.org/ 10.1177/13567667211003246
30. Guo, Y., Barnes, S. J., & Jia, Q. (2017). Mining meaning from online ratings and reviews: Tourist satisfaction analysis using latent dirichlet allocation. Tourism Management, 59, 467–483. Scopus. https://doi.org/10.1016/j.tourman.2016.09.009
31. Guo, Y., Sun, S., Schuckert, M., & Law, R. (2015). Online feedback and attraction management: An exploration of the critical factors in effective operations. Asia Pacific Journal of Tourism Research, 21(8), 883–904. Scopus. https://doi.org/ 10.1080/10941665.2015.1080740
32. He, W., Zha, S., & Li, L. (2013). Social media competitive analysis and text mining:
A case study in the pizza industry. International Journal of Information Management, 33(3), 464–472. Scopus. https://doi.org/10.1016/j.ijinfomgt.2013.01.001
33. Henrique de Souza, L., Kastenholz, E., & Barbosa, M. D. L. D. A. (2020). Relevant dimensions of tourist experiences in unique, alternative person-to-person accommodation-Sharing castles, treehouses, windmills, houseboats or house-buses. International Journal of Hospitality and Tourism Administration, 21(4), 390–421. Scopus. https://doi.org/10.1080/15256480.2018.1511495
34. Hu, F., Li, H., Liu, Y., & Teichert, T. (2020). Optimizing service offerings using asymmetric impact-sentiment-performance analysis. International Journal of Hospitality Management, 89. Scopus. https://doi.org/10.1016/j.ijhm.2020.102557
35. Hu, F., Teichert, T., Liu, Y., Li, H., & Gundyreva, E. (2019). Evolving customer expectations of hospitality services: Differences in attribute effects on satisfaction and Re-Patronage. Tourism Management, 74, 345–357. Scopus. https://doi.org/10.1016/j.tourman.2019.04.010
36. Huang, D., Chen, Q., Huang, J., Kong, S., & Li, Z. (2021). Customer-robot interactions: Understanding customer experience with service robot. International Journal of Hospitality Management, 99. Scopus. https://doi.org/10.1016/j.ijhm.2021.103078
37. Huang, N., Hong, Y., & Burtch, G. (2017). Social network integration and user content generation: Evidence from natural experiments. MIS Quarterly: Management Information Systems, 41(4), 1035–1058. Scopus. https://doi.org/ 10.25300/MISQ/2017/41.4.02
38. Hutter, K., Hautz, J., Dennhardt, S., & Füller, J. (2013). The impact of user interactions in social media on brand awareness and purchase intention: The case of MINI on Facebook. Journal of Product & Brand Management, 22(5/6), 342–351. https://doi.org/10.1108/JPBM-05-2013-0299
39. Hyman, D. A., Liu, J., & Black, B. S. (2022). Should patients use online reviews to pick their doctors and hospitals? Journal of Empirical Legal Studies, 19(4), 897–935. Scopus. https://doi.org/10.1111/jels.12338
40. Iswari, N. M. S., Afriliana, N., & Suryasari. (2022). User-generated content extraction: A bibliometric analysis of the research literature (2007–2022). Journal of Hunan University Natural Sciences, 49(11), 120–126. https://doi.org/10.55463/issn.16742974.49.11.14
41. Jin, C., Cheng, J., & Xu, J. (2018). Using user-generated content to explore the temporal heterogeneity in tourist mobility. Journal of Travel Research, 57(6), 779–791. Scopus. https://doi.org/10.1177/0047287517714906
42. Jin, C., & Xu, J. (2020). Using user-generated content data to analyze tourist mobility between hotels and attractions in cities. Environment and Planning B: Urban Analytics and City Science, 47(5), 826–840. Scopus. https://doi.org/10.1177/2399808318811666
43. Kaya, O. (2018). Exploring the satisfaction and dissatisfaction factors derived from food and beverage services of thermal hotels. Deturope, 10(3), 143–161. Scopus. https://www.scopus.com/inward/record.uri?eid=2-s2.0-85063641998&partnerID =40&md5=af555d92deccbfa6386c9430ec945c79
44. Khan, A. M., & Loan, F. A. (2022). Exploring the reviews of google maps to assess the user opinions about public libraries. Library Management, 43(8–9), 601–615. Scopus. https://doi.org/10.1108/LM-05-2022-0053
45. Khurana, S., Qiu, L., & Kumar, S. (2019). When a doctor knows, it shows: An empirical analysis of doctors’ responses in a Q&A forum of an online healthcare portal. Information Systems Research, 30(3), 872–891. Scopus. https://doi.org/ 10.1287/isre.2019.0836
46. Kim, B., Kim, S., & Heo, C. Y. (2016). Analysis of satisfiers and dissatisfiers in online hotel reviews on social media. International Journal of Contemporary Hospitality Management, 28(9), 1915–1936. Scopus. https://doi.org/10.1108/IJCHM-04-2015-0177
47. Kim, K., Park, O.-J., Yun, S., & Yun, H. (2017). What makes tourists feel negatively about tourism destinations? Application of hybrid text mining methodology to smart destination management. Technological Forecasting and Social Change, 123, 362–369. Scopus. https://doi.org/10.1016/j.techfore.2017.01.001
48. Kostromitina, M., Keller, D., Cavusoglu, M., & Beloin, K. (2021). “His lack of a mask ruined everything.” Restaurant customer satisfaction during the COVID-19 outbreak: An analysis of Yelp review texts and star-ratings. International Journal of Hospitality Management, 98. Scopus. https://doi.org/10.1016/j.ijhm.2021.103048
49. Lamb, Y., Cai, W., & McKenna, B. (2020). Exploring the complexity of the individualistic culture through social exchange in online reviews. International Journal of Information Management, 54. Scopus. https://doi.org/10.1016/j.ijinfomgt.2020.102198
50. Lee, M., Cai, Y., DeFranco, A., & Lee, J. (2020). Exploring influential factors affecting guest satisfaction: Big data and business analytics in consumer-generated reviews. Journal of Hospitality and Tourism Technology, 11(1), 137–153. Scopus. https://doi.org/10.1108/JHTT-07-2018-005
51. Li, Y.-H., Zheng, J., Yue, S.-T., & Fan, Z.-P. (2022). Capturing and analyzing e-WOM for travel products: A method based on sentiment analysis and stochastic dominance. Kybernetes, 51(10), 3041–3072. Scopus. https://doi.org/10.1108/K-02-2021-0146
52. Liao, H.-L., Huang, Z.-Y., & Liu, S.-H. (2021). The effects of negative online reviews on consumer perception, attitude and purchase intention: Experimental investigation of the amount, quality, and presentation order of eWOM. ACM Transactions on Asian and Low-Resource Language Information Processing, 20(3), 1–21. https://doi.org/ 10.1145/3426883
53. Lim, J., & Lee, H. C. (2020). Comparisons of service quality perceptions between full service carriers and low cost carriers in airline travel. Current Issues in Tourism, 23(10), 1261–1276. Scopus. https://doi.org/10.1080/13683500.2019.1604638
54. Lin, P. M. C., Tung, V. W. S., Qiu Zhang, H., & Gu, Q. (2018). Tourist experience on memorable hospitality services. Journal of China Tourism Research, 14(2), 123–145. Scopus. https://doi.org/10.1080/19388160.2018.1455613
55. Lin, S., Zuo, W., Lin, H., & Hu, Q. (2022). An online reviews information fusion method and its application to public property service quality evaluation. International Journal of Strategic Property Management, 26(1), 1–10. Scopus. https://doi.org/ 10.3846/ijspm.2022.16172
56. Liu, X., Burns, A. C., & Hou, Y. (2017). An investigation of brand-related user-generated content on twitter. Journal of Advertising, 46(2), 236–247. Scopus. https://doi.org/ 10.1080/00913367.2017.1297273
57. Liu, X.-X., & Chen, Z.-Y. (2022). Service quality evaluation and service improvement using online reviews: A framework combining deep learning with a hierarchical service quality model. Electronic Commerce Research and Applications, 54. Scopus. https://doi.org/10.1016/j.elerap.2022.101174
58. Liu, H., He, J., Wang, T., Song, W., & Du, X. (2013). Combining user preferences and user opinions for accurate recommendation. Electronic Commerce Research and Applications, 12(1), 14–23. Scopus. https://doi.org/10.1016/j.elerap.2012.05.002
59. Liu, F., Lai, K.-H., Wu, J., & Duan, W. (2021). Listening to online reviews: A mixedmethods investigation of customer experience in the sharing economy. Decision Support Systems, 149. Scopus. https://doi.org/10.1016/j.dss.2021.113609
60. Liu, Y., Teichert, T., Rossi, M., Li, H., & Hu, F. (2017). Big data for big insights: Investigating language-specific drivers of hotel satisfaction with 412,784 user-generated reviews. Tourism Management, 59, 554–563. Scopus. https://doi.org/10.1016/ j.tourman.2016.08.012
61. Lockie, M., Waiguny, M. K. J., & Grabner-Kräuter, S. (2015). How style, information depth and textual characteristics influence the usefulness of general practitioners’ reviews. Australasian Marketing Journal, 23(3), 168–178. Scopus. https://doi.org/ 10.1016/j.ausmj.2015.01.005
62. Lu, W., & Stepchenkova, S. (2012). Ecotourism experiences reported online: Classification of satisfaction attributes. Tourism Management, 33(3), 702–712. Scopus. https://doi.org/10.1016/j.tourman.2011.08.003
63. Lu, W., & Stepchenkova, S. (2015). User-generated content as a research mode in tourism and hospitality applications: Topics, methods, and software. Journal of Hospitality Marketing & Management, 24(2), 119–154. https://doi.org/ 10.1080/19368623.2014.907758
64. Luo, J., Huang, S., & Wang, R. (2021). A fine-grained sentiment analysis of online guest reviews of economy hotels in China. Journal of Hospitality Marketing and Management, 30(1), 71–95. Scopus. https://doi.org/10.1080/19368623.2020.1772163
65. Luo, J. M., Vu, H. Q., Li, G., & Law, R. (2021). Understanding service attributes of robot hotels: A sentiment analysis of customer online reviews. International Journal of Hospitality Management, 98. Scopus. https://doi.org/10.1016/j.ijhm.2021.103032
66. Lynn, M., & Kwortnik, R. J. (2020). Tipping policy effects on customer satisfaction: An informative failure to replicate. International Journal of Hospitality Management, 86. Scopus. https://doi.org/10.1016/j.ijhm.2019.102448
67. Manosso, Franciele Cristina, & Domareski Ruiz, Thays Cristina. (2021). Using sentiment analysis in tourism research: A systematic, bibliometric, and integrative review. https://doi.org/10.5281/ZENODO.5548426
68. Mathayomchan, B., & Taecharungroj, V. (2020). “How was your meal?” Examining customer experience using Google maps reviews. International Journal of Hospitality Management, 90. Scopus. https://doi.org/10.1016/j.ijhm.2020.102641
69. Medina, M. L. F., Estárico, E. H., & Marrero, S. M. (2016). Q certification and tourist satisfaction in the Spanish hotels. Cuadernos de Turismo, 37, 503–506 and 203–226. Scopus. https://www.scopus.com/inward/record.uri?eid=2-s2.0-84966671573&partner ID=40&md5=995596a7cc4c0a8743459b096760878b
70. Mejia, J., Mankad, S., & Gopal, A. (2021). Service quality using text mining: Measurement and consequences. Manufacturing and Service Operations Management, 23(6), 1354–1372. Scopus. https://doi.org/10.1287/msom.2020.0883
71. Mittal, D., & Agrawal, S. R. (2022). Determining banking service attributes from online reviews: Text mining and sentiment analysis. International Journal of Bank Marketing, 40(3), 558–577. Scopus. https://doi.org/10.1108/IJBM-08-2021-0380
72. Mkono, M. (2013). Existential authenticity in cultural restaurant experiences in Victoria Falls, Zimbabwe: A netnographic analysis. International Journal of Culture, Tourism, and Hospitality Research, 7(4), 353–363. Scopus. https://doi.org/10.1108/IJCTHR-032013-0010
73. Molina-Collado, A., Gómez-Rico, M., Sigala, M., Molina, M. V., Aranda, E., & Salinero, Y. (2022). Mapping tourism and hospitality research on information and communication technology: A bibliometric and scientific approach. Information Technology & Tourism, 24(2), 299–340. https://doi.org/10.1007/s40558-022-00227-8
74. Naeem, M., Ozuem, W., & Ward, P. (2022). Understanding the accessibility of retail mobile banking during the COVID-19 pandemic. International Journal of Retail and Distribution Management, 50(7), 860–879. Scopus. https://doi.org/10.1108/IJRDM-022021-0064
75. Nilashi, M., Abumalloh, R. A., Minaei-Bidgoli, B., Abdu Zogaan, W., Alhargan, A., Mohd, S., Syed Azhar, S. N. F., Asadi, S., & Samad, S. (2022). Revealing travellers’ satisfaction during COVID-19 outbreak: Moderating role of service quality. Journal of Retailing and Consumer Services, 64. Scopus. https://doi.org/10.1016/j.jretconser.2021.102783
76. Nilashi, M., Ahmadi, H., Arji, G., Alsalem, K. O., Samad, S., Ghabban, F., Alzahrani, A. O., Ahani, A., & Alarood, A. A. (2021). Big social data and customer decision making in vegetarian restaurants: A combined machine learning method. Journal of Retailing and Consumer Services, 62. Scopus. https://doi.org/10.1016/j.jretconser.2021.102630
77. OECD. (2007). Participative web and user-created content. Web 2.0, WIKIS and social networking. OECD Publishing. https://doi.org/10.1787/9789264037472-en
78. Palese, B., & Usai, A. (2018). The relative importance of service quality dimensions in E-commerce experiences. International Journal of Information Management, 40, 132–140. Scopus. https://doi.org/10.1016/j.ijinfomgt.2018.02.001
79. Parasuraman, A. P., Zeithaml, V. A., & Berry, L. L. (1988). SERVQUAL: A multiple-item scale for measuring consumer perceptions of service quality. Journal of Retailing, 64(1), 12–40. https://www.researchgate.net/publication/225083802
80. Park, E., Kang, J., Choi, D., & Han, J. (2020). Understanding customers’ hotel revisiting behaviour: A sentiment analysis of online feedback reviews. Current Issues in Tourism, 23(5), 605–611. Scopus. https://doi.org/10.1080/13683500.2018.1549025
81. Pjero, E., & Gjermëni, O. (2020). Tourist’s satisfaction in terms of accommodation: A case study in Vlore, Albania. Business Perspectives and Research, 8(1), 67–80. Scopus. https://doi.org/10.1177/2278533719860022
82. Pritchard, A. (1969). Statistical bibliography or bibliometrics? Journal of Documentation, 25(4), 348–349.
83. Racherla, P., & Friske, W. (2012). Perceived ‘usefulness’ of online consumer reviews: An exploratory investigation across three services categories. Electronic Commerce Research and Applications, 11(6), 548–559. Scopus. https://doi.org/10.1016/j.elerap.2012.06.003
84. Ranjbari, M., Shams Esfandabadi, Z., & Scagnelli, S. D. (2020). A big data approach to map the service quality of short-stay accommodation sharing. International Journal of Contemporary Hospitality Management, 32(8), 2575–2592. Scopus. https://doi.org/ 10.1108/IJCHM-02-2020-0097
85. Rasool, G., & Pathania, A. (2021). Reading between the lines: Untwining online usergenerated content using sentiment analysis. Journal of Research in Interactive Marketing, 15(3), 401–418. Scopus. https://doi.org/10.1108/JRIM-03-2020-0045
86. Rasool, A., Shah, F. A., & Islam, J. U. (2020). Customer engagement in the digital age: A review and research agenda. Current Opinion in Psychology, 36, 96–100. https://doi.org/10.1016/j.copsyc.2020.05.003
87. Schuckert, M., Liu, X., & Law, R. (2015). A segmentation of online reviews by language groups: How English and non-English speakers rate hotels differently. International Journal of Hospitality Management, 48, 143–149. Scopus. https://doi.org/10.1016/j.ijhm.2014.12.007
88. Sezgen, E., Mason, K. J., & Mayer, R. (2019). Voice of airline passenger: A text mining approach to understand customer satisfaction. Journal of Air Transport Management, 77, 65–74. Scopus. https://doi.org/10.1016/j.jairtraman.2019.04.001
89. Shadiyar, A., Ban, H.-J., & Kim, H.-S. (2020). Extracting key drivers of air passenger’s experience and satisfaction through online review analysis. Sustainability (Switzerland), 12(21), 1–20. Scopus. https://doi.org/10.3390/su12219188
90. Shang, Z.-Y., & Luo, J.-M. (2022). Topic modeling for hiking trail online reviews: Analysis of the mutianyu great wall. Sustainability (Switzerland), 14(6). Scopus. https://doi.org/10.3390/su14063246
91. Shen, C.-W., Luong, T.-H., Ho, J.-T., & Djailani, I. (2020). Social media marketing of IT service companies: Analysis using a concept-linking mining approach. Industrial Marketing Management, 90, 593–604. Scopus. https://doi.org/10.1016/
j.indmarman.2019.11.014
92. Shin, S., & Nicolau, J. L. (2022). Identifying attributes of wineries that increase visitor satisfaction and dissatisfaction: Applying an aspect extraction approach to online reviews. Tourism Management, 91. Scopus. https://doi.org/10.1016/j.tourman.2022.104528
93. Song, Y., Liu, K., Guo, L., Yang, Z., & Jin, M. (2022). Does hotel customer satisfaction change during the COVID-19? A perspective from online reviews. Journal of Hospitality and Tourism Management, 51, 132–138. Scopus. https://doi.org/10.1016j.jhtm.2022.02.027
94. Sreenivasan, N. D., Lee, C. S., & Goh, D. H.-L. (2012). Tweeting the friendly skies: Investigating information exchange among Twitter users about airlines. Program, 46(1), 21–42. Scopus. https://doi.org/10.1108/00330331211204548
95. Stepaniuk, K. (2016). Memetic pool as a new approach in service quality analysis. Engineering Management in Production and Services, 8(4), 94–102. Scopus. https://doi.org/10.1515/emj-2016-0037
96. Sthapit, E., & Björk, P. (2020). Towards a better understanding of interactive value formation: Three value outcomes perspective. Current Issues in Tourism, 23(6), 693–706. Scopus. https://doi.org/10.1080/13683500.2018.1520821
97. Sudhakar, S., & Gunasekar, S. (2020). Examining online ratings and customer satisfaction in airlines. Anatolia, 31(2), 260–273. Scopus. https://doi.org/10.1080/ 13032917.2020.1747238
98. Teichert, T., Rezaei, S., & Correa, J. C. (2020). Customers’ experiences of fast food delivery services: Uncovering the semantic core benefits, actual and augmented product by text mining. British Food Journal, 122(11), 3513–3528. Scopus. https://doi.org/ 10.1108/BFJ-12-2019-0909
99. Terziyska, I. (2021). One-day cultural tours in Bulgaria: A netnography study of customer satisfaction. Tourism, 69(2), 216–227. Scopus. https://doi.org/ 10.37741/T.69.2.4
100. Tontini, G., Bento, G. D. S., Milbratz, T. C., Volles, B. K., & Ferrari, D. (2017).
Exploring the nonlinear impact of critical incidents on customers’ general evaluation of hospitality services. International Journal of Hospitality Management, 66, 106–116.
Scopus. https://doi.org/10.1016/j.ijhm.2017.07.011
101. Veríssimo, M., & Costa, C. (2018). Do hostels play a role in pleasing Millennial travellers? The Portuguese case. Journal of Tourism Futures, 4(1), 57–68. Scopus.
https://doi.org/10.1108/JTF-12-2017-0054
102. Viswanathan, V., Malthouse, E. C., Maslowska, E., Hoornaert, S., & Van den Poel, D.
(2018). Dynamics between social media engagement, firm-generated content, and live and time-shifted TV viewing. Journal of Service Management, 29(3), 378–398. Scopus.
https://doi.org/10.1108/JOSM-09-2016-0241
103. Wąsowicz-Zaborek, E. (2020). Analiza treści generowanych przez użytkowników Internetu jako podstawa decyzji marketingowych w małym przedsiębiorstwie. In L. Bohdanowicz, & P. Dziurski (Eds.), Innowacje i marketing we współczesnych organizacjach: Wybrane zagadnienia (pp. 281–300). Oficyna Wydawnicza SGH.
104. Witherspoon, C. L., & Stone, D. N. (2013). Analysis and sentiment detection in online reviews of tax professionals: A comparison of three software packages. Journal of Emerging Technologies in Accounting, 10(1), 89–115. Scopus. https://doi.org/ 10.2308/jeta-50747
105. Wong, I. A., Huang, J., Lin, Z. C. J., & Jiao, H. (2022). Smart dining, smart restaurant, and smart service quality (SSQ). International Journal of Contemporary Hospitality Management, 34(6), 2272–2297. Scopus. https://doi.org/10.1108/IJCHM-10-2021-1207
106. Xie, K., Kwok, L., & Wang, W. (2017). Monetizing managerial responses on tripadvisor: Performance implications across hotel classes. Cornell Hospitality Quarterly, 58(3), 240–252. Scopus. https://doi.org/10.1177/1938965516686109
107. Xu, X., & Li, Y. (2016). The antecedents of customer satisfaction and dissatisfaction toward various types of hotels: A text mining approach. International Journal of Hospitality Management, 55, 57–69. Scopus. https://doi.org/10.1016/j.ijhm.2016.03.003
108. Ye, Y., Zhao, Y., Shang, J., & Zhang, L. (2019). A hybrid IT framework for identifying high-quality physicians using big data analytics. International Journal of Information Management, 47, 65–75. Scopus. https://doi.org/10.1016/j.ijinfomgt.2019.01.005
109. Yu, M., Cheng, M., Yang, L., & Yu, Z. (2022). Hotel guest satisfaction during COVID-19 outbreak: The moderating role of crisis response strategy. Tourism Management, 93. Scopus. https://doi.org/10.1016/j.tourman.2022.104618
110. Yu, T., Rita, P., Moro, S., & Oliveira, C. (2022). Insights from sentiment analysis to leverage local tourism business in restaurants. International Journal of Culture, Tourism, and Hospitality Research, 16(1), 321–336. Scopus. https://doi.org/ 10.1108/IJCTHR-02-2021-0037
111. Yu, C.-E., & Zhang, X. (2020). The embedded feelings in local gastronomy: A sentiment analysis of online reviews. Journal of Hospitality and Tourism Technology, 11(3), 461–478. Scopus. https://doi.org/10.1108/JHTT-02-2019-0028
112. Zhang, J., Lu, X., & Liu, D. (2021). Deriving customer preferences for hotels based on aspect-level sentiment analysis of online reviews. Electronic Commerce Research and Applications, 49. Scopus. https://doi.org/10.1016/j.elerap.2021.101094
113. Zibarzani, M., Abumalloh, R. A., Nilashi, M., Samad, S., Alghamdi, O. A., Nayer, F. K., Ismail, M. Y., Mohd, S., & Mohammed Akib, N. A. (2022). Customer satisfaction with Restaurants Service Quality during COVID-19 outbreak: A two-stage methodology.
Technology in Society, 70. Scopus. https://doi.org/10.1016/j.techsoc.2022.101977
114. Zuo, W., Bai, W., Zhu, W., He, X., & Qiu, X. (2022). Changes in service quality of sharing accommodation: Evidence from Airbnb. Technology in Society, 71. Scopus. https://doi.org/10.1016/j.techsoc.2022.102092
115. Zupic, I., & Èater, T. (2015). Bibliometric methods in management and organization. Organizational Research Methods, 18(3), 429–472. https://doi.org/10.1177/1094428114562629
Elżbieta Wąsowicz-Zaborek — Assistant Professor affiliated with the SGH Warsaw School of Economics. The primary concentration of her research interests lies in contemporary place and services marketing, with a particular emphasis on the tourism industry. In her research projects, she employs a variety of qualitative and quantitative methodologies, as well as a mixed methods approach.

