
Ireneusz P. Rutkowski
Poznań University of Economics, Institute of Management,
10 Niepodległości Ave., 61-875 Poznań, Poland
E-mail: Ireneusz.Rutkowski@ue.poznan.pl
ORCID: 0000-0002-3821-3533
DOI: 10.2478/minib-2025-0003
Abstract:
This article discusses the use of Stevens’ measurement scales in marketing research, contributing to a broader discussion, underway for over 70 years, as to whether researchers can ignore the Likert scale’s limitations as an ordinal scale. The central question explored is whether the use of various statistical methods and techniques in marketing research has gone too far, limiting researchers’ horizon of thought, leading erroneous conclusions to be drawn, and diverting attention from trying to explain the non-quantitative attitudes of consumers (who are people, not machines or AIs). Stevens’ measurement scales are still widely used in data analysis across social sciences, including marketing research. Although they were revolutionary, they had certain flaws which have fueled an ongoing debate about the acceptability or permissibility of using different tests and statistical techniques at different scales and levels of measurement. The Likert scale, one of the scales most frequently used to measure customer attitudes, was intended to overcome the limitations of simple scales, having the advantage of being multi-item. However, historically, two competing views have evolved independently of each other, in the related literature and in the practice of empirical research: one emphasizing the ordinal nature of Likert scales, the other interpreting them as having interval-scale properties. This debate has significant consequences for the permissible scope of statistical analysis of empirical data. The problem discussed here is likely to become even more complex with the development of artificial intelligence (AI), machine learning, data science and big data, as data scientists perform computational analysis but are not often involved in data collection or deciding about how data is represented.

Stevens’ measurement scales in marketing research – A continuation of discussion on whether researchers can ignore the Likert scale’s limitations as an ordinal scale
1. Introduction
A distinctive feature of contemporary marketing research, and more broadly speaking, of economic and social science research, is its advanced mathematization – understood here as the application of mathematical methods to capture the essence of some phenomenon. At its core, this process involves the permissible mathematical transformations that can be applied to a dataset, which determine the applicability of various statistical and econometric techniques with respect to the type of measurement scale. To facilitate the use of mathematics in drawing empirical conclusions from psychological data, which are often ordinal in nature, S.S. Stevens redefined measurement as “the assignment of numbers to objects and events in accordance with a rule” (Stevens, 1946). He introduced four fundamental types of scales that comprise measurement instruments – nominal, ordinal, interval, and ratio scales – and established criteria for the permissible statistical tests, methods and techniques that should be applied to each of them.
Stevens’ scales of measurement are still widely used in data analysis in the natural and social sciences, including marketing research. They were revolutionary, but they have certain flaws which have fueled an ongoing debate about the acceptability of using different tests and statistical techniques at different scales and levels of measurement (i.e. weak vs. strong scales). Instead of relying on Stevens’ scales, researchers may need to demonstrate the mathematical properties of their data and map them to analogous sets of numbers, making explicit claims about mathematization, defending them with proofs, and applying only those operations that are defined for that set (Thomas, 2019). Increasing mathematization can be explained by the needs of maximization, optimization, modeling, and forecasting.
However, we must ask whether the application of various statistical methods and techniques in marketing research has go too far, limiting the researchers’ horizon of thought, leading erroneous conclusions to be drawn, and diverting attention from trying to explain the non-quantitative attitudes, motives, opinions, needs, expectations, preferences of consumers (who are people, not machines or AIs). Addressing this question is the main goal of the article.
People’s attitudes are comprised of three closely related components: cognitive, affective and behavioral dispositions. Together these elements form a set of beliefs about the nature of the attitude object, making it difficult to establish clear boundaries between them at the measurement stage. Therefore, it is impossible to indicate where purely descriptive knowledge about the attitude object, or ideas about its nature, end and emotions and where assessments begin, where knowledge and assessments of the object end and where readiness, intention or sense of obligation to undertake specific behaviors towards the object (such as a purchase decision) begins (Nowak 1973; Escher 2010). This type of explanation is the key justification for the common practice of determining the direction and strength of attitudes only based on measurement of opinions expressed with varying degrees of acceptance.
The Likert scale is one of the most frequently used scales for measuring the direction and strength of attitudes of customers, consumers, and people in general. It was constructed to be applicable to measuring hidden phenomena (Likert, 1932) and was intended to overcome the limitations of simple scales, having the advantage of being multi-item. The method of appropriately using and analyzing data obtained on Likert-type measurement scales has been the subject of discussion for over 70 years. There are basically two main, competing views, which have evolved independently of each other, in the related literature and in the practice of empirical research. Historically, there has been a debate between those who support viewing the Likert scale in terms of ordinality (rank order – the present author is a supporter of this approach) and those who support intervalism – ascribing an interval-scale nature to the Likert scale (Burke, 1953; Glass, 1972; Walesiak, 1996; Kampen & Swyngedouw, 2000; Francuz & Mackiewicz, 2007; Jamieson, 2004; Carifio & Perla, 2008; Kaczmarek & Tarka, 2013; Kero & Lee, 2016). Supporters of the first approach point to Siegel’s argument (“the properties of an ordinal scale are not isomorphic to the number system known as arithmetic”, Siegel, 1956, p. 26), while opponents point to the authority of K. Pearson (1909), who pointed out that measurements on an ordinal scale can be treated as a certain version of measurements on an interval scale (for discussion, see Francuz & Mackiewicz, 2007, pp. 388–390).
The lack of a natural or arbitrary zero on the Likert scale creates a certain problem, so we do not know whether the distances on the scale are the same. For instance, is the distance on the Likert scale between “I completely agree”, coded as 5, and “I completely disagree”, coded as 1, equal to 4? Unfortunately, this remains unknown, because the “numbers” on this scale play a different role than they do, for instance, in the mathematical formula 5 – 1 = 4. The numbers on the Likert scale could be replaced, for example, with typographic symbols, such as emoticons. This fact determines the admissibility of using specific statistical methods and techniques in the process of data processing and inference. If a researcher calculates the arithmetic mean and standard deviation of data obtained on an ordinal scale, this is evidence either that they misunderstand measurement theory (whereby the type of scale is determined according to Stevens), or that they are implicitly assuming that the given scale is not an ordinal scale, but rather possesses interval properties.
Given that most of what is directly measured in marketing research – and often also in sociological, psychological, and even medical research – is measured suing ordinal Likert-type scales, a critical question remains: Is expressing ratings on an n-point “scale” (with 5, 7, or more points) truly a measurement on an ordinal scale? This issue extends beyond concerns about the “distances” between scale values; also pertains to whether a single numerical value can accurately represent a set of indistinguishable observations, as required by measurement theory.
2. The issue of interval or lack of interval of the Likert measurement scale
The Likert scale and its variants are situated on the ordinal level of measurement (Pett, 1997; Blaikie, 2003). This means that response categories, and therefore data obtained in ordinal-level measurement, are characterized by a rank order, and hence these empirical data can be compared and sorted. However, in research practice, these data are also often subjected to reduction processes, including latent variable analysis and correlation assessments, seeking to identify underlying factors that serve as the basis for empirical scaling and index construction. Yet it cannot be assumed that the intervals between values on the Likert scale are equal – although, as Blaikie (2003) points out, “researchers frequently assume that they are”. However, Cohen et al. (2000) claim that it is “unjustified” to conclude that the difference in intensity of feelings between “strongly disagree” and “disagree” is equivalent to the difference in intensity of feelings between other consecutive categories on the Likert scale. Nominal and ordinal variables (as well as interval and ratio variables) require different statistical approaches, and if an inappropriate statistical technique is applied, the risk of drawing erroneous conclusions from research findings (positive or negative verification of research hypotheses) significantly increases.
The scientific literature on statistics and research methodology consistently emphasizes that, for ordinal data, the median or mode should be used as a “measure of the central tendency”, rather than the mean. This is because the arithmetic manipulations required to calculate the mean (and the standard deviation) are inappropriate for data obtained by measurement on an ordinal scale, where numbers usually represent verbal statements (Clegg, 1998). Ordinal data can also be described using frequencies/percentages of responses in each category. Moreover, it is recommended that appropriate statistical inference for ordinal data be performed using nonparametric tests, such as Chi-square, Spearman’s Rho, or the Mann-Whitney U test, rather than parametric tests, because the latter require data at the level of interval or ratio scale measurement (Mann & Whitney, 1947; Lieberson, 1964; Myers, 2003; Sobczyk, 2007).
However, in practice these “rules” are often ignored by the authors of scientific articles, master’s theses, doctoral dissertations, and reports prepared by national and international research agencies. Such authors may, for instance, use a Likert scale, but describe and analyze the empirical data using means and standard deviations and conduct parametric analyses such as ANOVA. This is consistent with Blaikie’s observation that it has become common practice to assume that data obtained from a Likert scale measure can be processed like data obtained from an interval scale measure (at the interval level). In general, such authors do not clarify whether they are even aware that some would consider this to be invalid. There is often no explicit justification for assuming that Likert scale data has interval properties, nor any argument is provided to support this assumption.
3. Permissible operations on numbers depending on the type of measurement scales
In marketing research, in particular, the proper use of measurement scales is one of the basic problems. According to Stevens (1946), the permissible operations that can be performed on numerical data depend on the type of measurement scales used for the variables studied. Therefore, a different procedure is required when dealing with a data matrix that includes quantitative variables measured on scales of different types – i.e. when in addition to variables measured on strong measurement scales (i.e. interval and ratio scales), there are qualitative variables, characteristic of marketing research, measured on weak nominal and ordinal scales (e.g. data obtained from the measurement of attitudes, opinions, attitudes, preferences and expectations of recipients; product architecture and image; data from measurements of the color, quality and taste of products, packaging properties, opinions on the price level).
When all variables in a dataset are measured on a single type of scale, especially strong scales, the choice of statistical and econometric methods for analysis and interpretation is relatively straightforward. The problem of the transformation of measurement scales and permissible mathematical and statistical transformations for data obtained in individual types of measurement scales nevertheless often becomes apparent in social, economic and marketing research (Walesiak, 2014). What approach should researchers adopt, when specialist sources say one thing but common practice is different? The treatment of ordinal scales as interval scales, although common, has long been controversial (e.g. discussed by Walesiak, 1996) and – it seems – remains so. Kuzon et al. (1996) referred to the application of parametric tests to analyze ordinal data as the first of the “seven deadly sins of statistical analysis”. Knapp (1990), however, found some merit in the argument that sample size and distribution are more important than the level of measurement when determining whether it is appropriate to use parametric tests to assess specific parameter values for a given population from which the sample is drawn. These parameters may be the mean, variance or standard deviation.
Nevertheless, even if we accept that the status of intervals is justified in the case of data obtained using the Likert method, datasets generated using Likert-type scales often have a skewed or polarized distribution (e.g., when most respondents “agree” or “strongly agree” that a given brand of beer was tasty, or when respondents have polarized views on the “color of a beer bottle,” depending on their place of residence). Therefore, if we want to improve the quality of research in social sciences, and in marketing research in particular, such issues as the level of measurement and adequacy of mean, standard deviation, and parametric statistics should be taken into account already at the stage of research design, and authors must address them when discussing their chosen research methodology and the individual phases and stages of the research process, including specific activities, methods, and expected results at a given stage. Knapp (1990) proposed that researchers should decide what level of measurement is being used. To paraphrase: if data are measured on the interval level, for outcome x the researcher should be able to answer the question “x what?”. If the data are clearly ordinal, nonparametric tests should be used; and if the researcher is confident that the data can be reasonably classified as interval, attention should nevertheless be paid to the sample size, its representativeness, and whether the distribution is normal.
Finally, can we assume that Likert-type scales are interval scales? I remain convinced by the above arguments of Kuzon and Knapp. To paraphrase their reasoning: the average of “strongly agree” and “strongly disagree” is not “neutral and a half”, and this is true even when whole numbers are assigned to represent those who “disagree” and “agree”!
In the design phase and implementation phase of the research process, researchers must also resolve methodological issues. The basic distinction drawn is between qualitative and quantitative methods. The former are characterized by a holistic approach to the research object, treating it as an individualized entity and seeking to uncover the deepest possible research findings, understanding the very essence of phenomena being studied. Qualitative methods are therefore particularly suitable in social sciences, especially in marketing, for such purposes as the analysis of subjective customer experiences, the meanings of messages, the motivations and attitudes of participants in market exchange processes, or for holistically reconstructing or predicting the course of specific market processes (Bryman, 2005; Devine, 2006). Quantitative methods, on the other hand, are based on completely different logic, assumptions and research goals. When applying them, the researcher should accept that the obtained results will not be as deep as in the case of qualitative research, that certain nuances and subtleties will be naturally omitted, and that the studied phenomena will be treated aspectually and without an individualized approach. In exchange, the research results, i.e. the new information, may be more reliable and objective (not burdened with the subjectivity of the subject or object of cognition), unambiguous and precise in interpretation, while at the same time providing greater possibilities for generalization and, above all, making good decisions.
However, the potential benefits of the quantitative approach can be achieved only if the research is conducted carefully, methodically, and with strict control of the research process. The key element here is the measurement of variables. This is the thread connecting theoretical categories with empirical research and the means by which the former can be analyzed (Bryman, 2004). The essence of quantitative research is that the objects studied are not treated as holistic, ontologically separated entities, but as bundles of variables characterizing them. The main goal of quantitative research is to find relationships between these variables, through analyses revealing appropriate statistical relationships or their absence (Białas, 1999). However, in order for these analyses to be reliable and accurate, they must be based on input data of appropriate quality. Without this, they would be worthless, because statistics is only a tool and in itself cannot tell us anything valuable about market reality without solid work by the researcher and analyst.
This means that the element that determines the quality of the entire research process is measurement, understood as a sequence of research activities “aimed at determining the value of a specific quantity, and thus a numerical comparison of this value with a unit of measurement” (Szewczak, 2010). The activities that make up measurement may include the application of certain measuring tools, observation of their readings, as well as appropriate processing of directly obtained results – e.g. various calculations leading to determining the value sought. In short, “measurement is the assignment of numbers to objects in such a way that these numbers reflect the relations between these objects.” In the so-called representational approach to measurement, it is assumed that the measured properties are determined by means of empirical relations between objects, that can be characterized by them (Szewczak, 2010).
4. Measurement scales in measurement theory and properties of measurement scales according to Stevens’ classification
Measurement theory encompasses the entire scope of the measurement procedure, which also includes the construction of measurement scales, which serve as the instruments by means of which the value of a variable is measured. The researcher therefore performs an operation, by means of which the relations between certain objects can be observed, measured and interpreted. Regardless of whether we treat measurement scale construction as a separate research procedure or an integral part of measurement itself, it is one of the most important determinants of the reliability, validity and accuracy of quantitative study and to a large extent determines whether the results of study (useful information) can be considered valuable in the decision-making process. Only reliable instruments or measurement tools can ensure that the values of the variables subject to analysis correspond to actual characteristics of objects studied, and results of these analyses accurately reflect the structure of the market reality under study (Lissowski et al., 2008).
Constructing a measurement scale is not an easy task, it requires appropriate methodological competences and knowledge about the phenomenon or event being measured. It is also a time-consuming process. Therefore, in research practice, there may be a temptation to take shortcuts – omitting certain important elements, or even creating an ad hoc scale based on related indicators, selected according to the criterion of data availability, and then assuming that when summed up, these will jointly measure a phenomenon, event or process. Such an approach is not recommendable, because it leads to the creation of research artifacts and amounts to the mere simulation of scientific inquiry. A methodologically rigorous and reliable scale creation process, in contrast, ensures the reliability and credibility of the obtained instrument or tool. Although this process demands substantial effort and time, the benefits are significant: well-constructed measurement tools yield results that contribute to scientific knowledge and inform decision-making processes.
Researchers rely on multiple sources of information in their research, diagnostic, and prognostic endeavors, seeking to achieve both scientific and practical, utilitarian goals. A crucial part of this process involves selecting the appropriate measurement scales and research instruments to use. However, the measurement scales used must simultaneously meet several important criteria: (a) standardization, (b) reliability, (c) validity, (d) normalization, (e) feasibility of use (Stevens, 1956).
In marketing research, the concept of “scale” appears in three basic meanings (Sagan, 2003):
- in the relational sense, a scale defines the field of permissible transformations of sets of measured objects into a set of symbols while maintaining the principle of homomorphism, establishing a set of statistical analysis tools permissible for a given level;
- as an outcome of the research procedure, a scale defines the positions of respondents at discrete points or along the continuum of the measured feature (discrete-step or continuous variables);
- in data collection, a scale is a set of conventional categories or response patterns, in estimated graphic scales or so-called rank scales, which are instruments for collecting information and defining the direction and strength of respondents’ reactions to a given item within a complex measurement scale.
In the relational meaning of scale, the classification of measurement scales by the aforementioned S.S. Stevens (1946 and 1951) is adopted in marketing research methodology. This approach assumes that the type of measurement scale is known in relation to a given level of measurement. However, this distinction may be problematic for researchers in empirical identification, especially in relation to ordinal and interval scales. In contrast, researchers should have no problems distinguishing qualitative and quantitative data, discrete/step variables and continuous variables. The problems with the classification of Stevens’ measurement scales noticed in literature may be related to the fact that researchers may not recognize the type of scale a priori. The measurement operation is also related to theoretical construct adopted by researchers. The measurement procedure on Stevens’ scales, however, ensures access to data that are “empirically” at the appropriate level of measurement, and the transformation of variables that is mathematically and statistically permissible for a given level does not change their position at the points of the scale or its continuum (Townsend & Ashby, 1984; Mitchell, 1986). A measurement scale can also be treated as the result of a research procedure that determines position of respondents on a continuum (understood as a continuous, ordered set of an infinite number of elements that smoothly transition from one to another), or at points of measured feature. This is how the attitude scales of Likert (ordinal scale), Guttman (ordinal scale), and Thurstone (interval scale) are constructed and defined – the sum of the ratings for an individual respondent in relation to all items of a one-dimensional scale indicates the respondent’s position at points or on the continuum of the measured attitude, depending on its strength and direction.
In cases where a respondent’s position is determined by summing their individual scores across the scale, the result is essentially an attitude index (the scale is arbitrary in nature). However, when a respondent’s position is derived from specific mathematical procedures transforming raw scores (e.g. into factor values), then the resulting measure can be classified as an attitude scale (Sagan 2003).
Measurement scales are ordered from the weakest (nominal) to the strongest (quotient). In his foundational work, Stevens (1946) distinguished between intensive and extensive scales, emphasizing that the type of scale is associated with possible transformations that preserve its properties. The basic properties of Stevens’ measurement scales are presented in Table 1. The type of scale used to measure the value of a given variable (statistical feature), or more precisely, the properties of the chosen scale, determine the statistical methods that can be applied (Adams et al. 1965). The first two scales are classified as nonmetric (weak) scales, and the remaining two as metric (strong) scales.
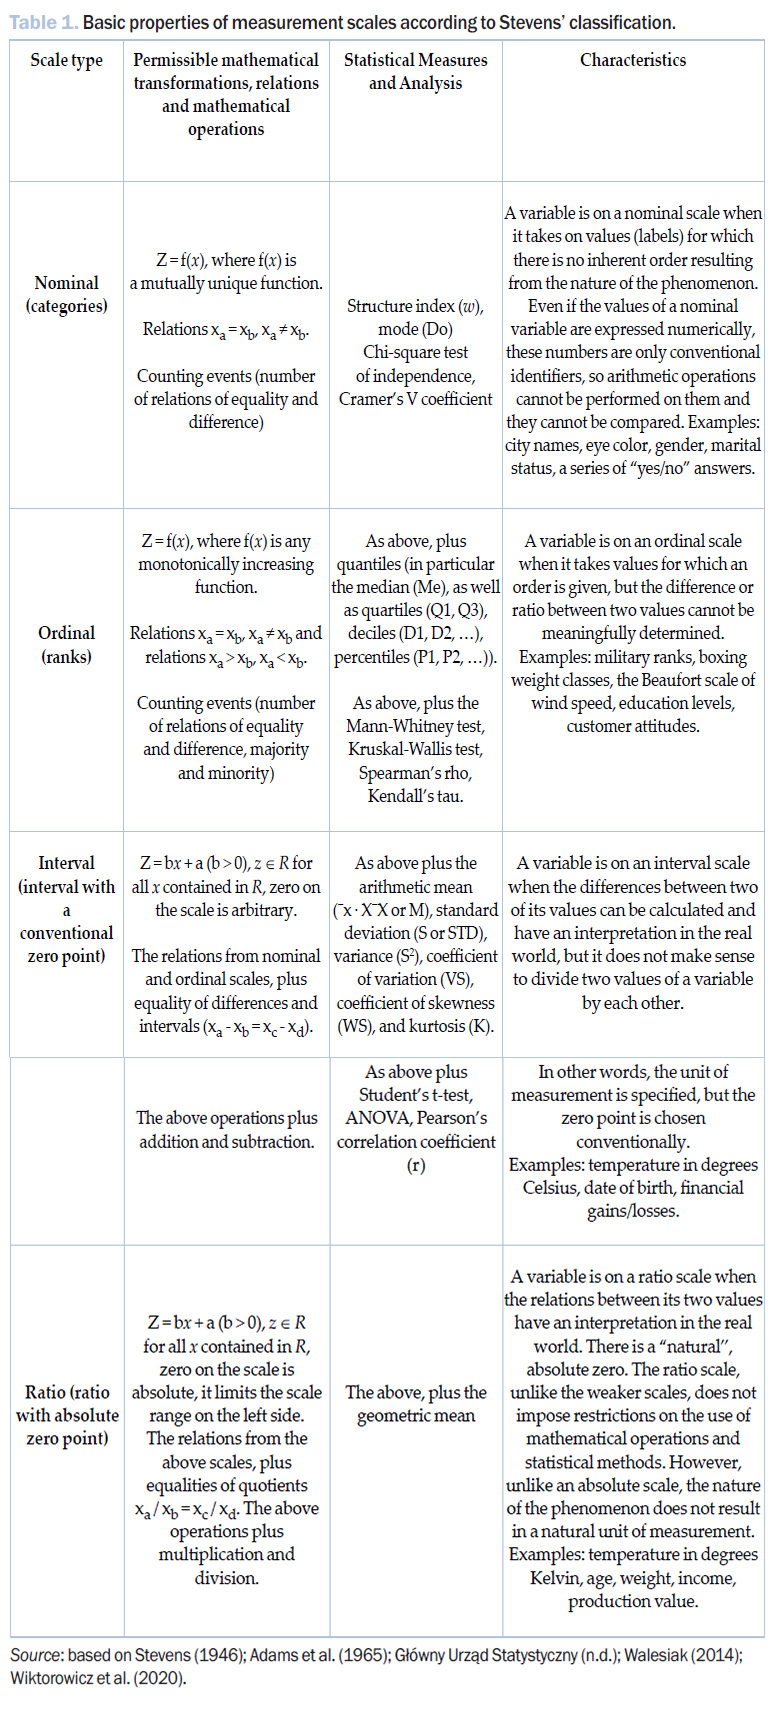
It is important to recognize that the order of scales determines their level (power, strength). Nominal and ordinal scales are non-metric and qualitative scales, while interval and ratio scales are metric and quantitative. The metric scales are commonly treated in research together as a quantitative scale – this is the case in most statistical packages, including SPSS and Statistica. In experimental sciences, variables measured on a nominal and ordinal scale are most often referred to as discrete, and those measured on a quantitative scale as continuous. The distinction between measurement scales can therefore be summarized as follows (Wiktorowicz et al., 2020):
- When comparing the values of a variable expressed on a nominal scale (e.g. gender), we are only able to indicate whether two people have the same or a different variant of the variable.
- If we can additionally indicate which person has a higher variant of the variable (but we are not able to determine how much higher), we are dealing with a variable measured on an ordinal scale (this is the case, for example, with level of education or a feature measured on a Likert scale).
- If we can additionally indicate how much higher or lower a given variant is (distances are fixed), we are dealing with a quantitative scale.
And so, the stronger the measurement scale, the greater the accuracy of measurement, which in turn enables researchers to apply other advanced and complex methods of statistical analysis.
The data matrix is the starting point for mathematization and the application of statistical methods. The problem of applying, for example, multivariate statistical analysis methods becomes more complicated when variables in the dataset are measured on mixed scales or contain variables measured only on weak scales (especially on an ordinal scale). The problem of using methods like multidimensional statistical analysis, for example, occurs when variables in a data matrix are measured on non-metric scales.
The Likert scale is precisely such a non-metric scale, meaning it does not inherently possess the mathematical properties required for interval or ratio measurement. This raises the question of whether it is permissible to apply statistical tools designed for metric data to non-metric variables. One fundamental principle of measurement theory states that only measurement results on a stronger scale (interval, ratio) can be transformed into numbers belonging to a weaker scale (nominal, ordinal) (Steczkowski & Zeliaś, 1981;Wiśniewski, 1987; Walesiak, 1996, Jezior, 2013). Direct transformation of scales, consisting in their strengthening, is not possible, because from information Xn it is not possible to derive Xn+1 information or more (Walesiak, 1993). Whether mathematical manipulation of an empirical data matrix leads to valid research conclusions depends, among other things, on the validity of the initial mathematization of attitudes and the validity of the subsequent mathematization of empirical data, i.e. the permitted mathematical transformations, relations, and mathematical operations on these data. If attitudes are measured on an ordinal scale, respondents’ answers are only coded as real numbers, and mathematical operations are performed that are defined only for real numbers, not ordinal numbers, then these mathematical operations on the data matrix have no empirical equivalent and do not provide a basis for inferences or conclusions about attitudes.
If attitudes and perceptions exhibit the mathematical properties of real numbers and are limited, and statements offered on the Likert scale correctly define endpoints and consistent intervals on an attitude continuum, then there are two possibilities. The empirical data matrix can be mathematized as ordinal numbers because the data has mathematical properties of ordinal numbers, although this results in a loss of information.
However, the arithmetic mean and standard deviation cannot be calculated because they are undefined. Alternatively, the numerical values in the empirical data matrix can be real, and conversion of data into numbers involves rescaling. In this case, the numbers contained in data matrix are analogous to the object of study, operations are defined, and mathematical and statistical inferences lead to valid empirical conclusions.
5. Likert did not recommend calculating averages for data obtained on his scale
Rensis Likert, in 1932, cited Thurstone and Chave when he assumed that attitudes were formed on a linear “continuum of attitudes,” which was the basis for his explanation of how to construct a scale to measure attitudes (Likert, 1932). Likert proposed measuring attitudes based on respondents’ agreement with statements developed by researcher, the respondent marking various points on the “continuum” of attitudes. The statements should be arranged in order from one end of continuum to the other. Likert then explained that the statements should be assigned numbers, from one to five, in the case of a question with five options, with the number “one” being assigned to one end of the continuum and “five” to the other. Likert did not explicitly discuss the mathematical properties of these numbers, but he recommended calculating a correlation coefficient for each statement to ensure that the statement was numbered correctly, and he provided a table as an example. He treated the numbers of answers as if they were real numbers, and the continuum of attitudes as if they were limited (Likert, 1932, p. 50).
Likert did not recommend calculating average values, as is confirmed by this quote from his work:
The split-half reliability should be found by correlating the sum of the odd statements for each individual against the sum of the even statements. Since each statement is answered by each individual, calculations can be reduced by using the sum rather than the average. (Likert 1932, p. 48)
This, in turn, yields a clear answer to the question of whether the use of various statistical methods and techniques in marketing research has gone too far in empirical research on the nature of attitudes.
Returning to the discussion on the mathematical properties of the Likert measurement scale described earlier, this debate does not address the mathematical properties of attitudes themselves, on which the proper mathematization of the empirical data matrix depends. In fact, it is not even entirely clear whether attitudes can be ordered. There is ongoing debate in psychology, economics, and marketing about whether the evidence supports the idea that attitudes and preferences adhere to the principle of transitivity (if a > b and b > c, then a > c) (see, e.g., Regenwetter & Dana, 2011; Bleichrodt & Wakker, 2015), which is a property of both ordinal and real numbers. Additionally, Johnson (1936) raised early concerns about whether attitudes are dynamically stable. Whether various statistical operations are defined on Likert items and scales depends on how the empirical data matrix is mathematized. Performing operations that are not defined in mathematics is not mathematics – and as a result, it does not provide a valid basis for drawing empirical conclusions.
6. Conclusions
Given length constraints, this article concludes by proposing that future discussion should explore the following methodological issues regarding the incorrect treatment of different versions of the Likert scale as interval scales:
- the violation of the principle of equal intervals, which results from the principle of measurement isomorphism/homomorphism (especially “at the extremes” of the Likert scale, e.g. comparing distances 1–2 and 6–7);
- the validity of applying Thurstone’s method of successive interval scaling and other transformational procedures to Likert scales;
- the degree of suppression of Pearson correlation coefficients when calculated for Likert scales and the size of this suppression depending on the number of points – notably, 5–7 point scales are relatively resistant to the suppression effect;
- alternative measures and methods for analyzing multi-item Likert scales, such as using polychoric correlation coefficients instead of Pearson’s in the analysis of data with Likert scales (Sagan 2014).
The problem discussed herein is likely to become even more complex with the development of AI, machine learning, and data science and big data, because data scientists perform computational analysis but are not often involved in collecting the data or making decisions about how it is represented. They lack access to information about the empirical mathematical properties of the object of study, the evidence supporting the mathematization, and the set of numbers used, and moreover the programming languages they use may or may not allow for classification of the data by set of numbers or impose restrictions on the mathematical operations performed on the data with respect to type. This also encourages the treatment of all numbers as real, reducing the validity of empirical conclusions from the research process.
References
Adams, E. W., Fagot, R. F., & Robinson, R. E. (1965). A theory of appropriate statistics. Psychometrika, 30(1), 99–127.
Białas, S. (1999). Metrologia techniczna z podstawami tolerowania wielkości geometrycznych dla mechaników [Technical metrology with fundamentals of geometric dimensioning for mechanics]. Oficyna Wydawnicza Politechniki Warszawskiej.
Blaikie, N. (2003). Analyzing quantitative data. SAGE Publications.
Bleichrodt, H., & Wakker, P. (2015). Regret theory: A bold alternative to the alternatives. The Economic Journal, 125(583), 493–532.
Bligh, J. (2004). Ring the changes: Some resolutions for the new year and beyond. Medical Education, 38(1), 2–4.
Bryman, A. (2005). Research methods and organization studies. Routledge.
Bryman, A. (1988). Quantity and quality in social research (1st ed.). Routledge. https://doi.org/10.4324/9780203410028
Burke, C. J. (1953). Additive scales and statistics. Psychological Review, 60(1), 73–75.
Carifio, J., & Perla, R. (2007). Ten common misunderstandings, misconceptions, persistent myths, and urban legends about Likert scales and Likert response formats and their antidotes. Journal of Social Sciences, 3(2), 106–116.
Churchill, G. A. (2002). Badania marketingowe. Podstawy metodologiczne [Marketing research: Methodological foundations]. Wydawnictwo Naukowe PWN.
Clegg, F. (1998). Simple statistics. Cambridge University Press.
Cohen, L., Manion, L., & Morrison, K. (2000). Research methods in education (5th ed.). Routledge Falmer. https://doi.org/10.4324/9780203224342
Devine, F. (2006). Metody jakościowe [Qualitative methods]. In D. Marsh & G. Stoker (Eds.), Teorie i metody w naukach politycznych [Theories and methods in political sciences] (pp. 197–200).
Diamantopoulos, A., & Winklhofer, H. M. (2001). Index construction with formative indicators: An alternative to scale development. Journal of Marketing Research, 38(2), 269–277.
Escher, I. (2010). Pomiar kierunku i siły marketingowej postawy pracownika – kompromis pomiędzy teorią a praktyką marketingową [Measuring the direction and strength of employee marketing attitudes – a compromise between theory and marketing practice]. Acta Universitatis Nicolai Copernici, Ekonomia, 41(397), 159–174.
Fornell, C., & Bookstein, F. (1982). Two structural equation models: LISREL and PLS applied to consumer exit-voice theory. Journal of Marketing Research, 19(4), 440–452.
Francuz, P., & Mackiewicz, R. (2007). Liczby nie wiedzą skąd pochodzą. Przewodnik po metodologii i statystyce nie tylko dla psychologów [Numbers don’t know where they come from. A guide to methodology and statistics not only for psychologists]. Redakcja Wydawnictw Katolickiego Uniwersytetu Lubelskiego.
Frankfort-Nachmias, C., & Nachmias, D. (2001). Metody badawcze w naukach społecznych [Research methods in social sciences]. Zysk i S-ka.
Glass, G. V., Peckham, P. D., & Sanders, J. R. (1972). Consequences of failure to meet assumptions underlying the fixed effects analyses of variance and covariance. Review of Educational Research, 42(3), 237–288.
Główny Urząd Statystyczny. (n.d.). Pojęcia stosowane w statystyce publicznej [Concepts used in public statistics]. Główny Urząd Statystyczny. Retrieved March 1, 2025, from https://stat.gov.pl/ metainformacje/slownik-pojec/pojecia-stosowane-w-statystyce-publicznej/2924,pojecie.html
Hansen, J. P. (2003). CAN’T MISS – Conquer any number task by making important statistics simple. Part 1. Types of variables, mean, median, variance, and standard deviation. Journal of Healthcare Quality, 25(4), 19–24.
Jamieson, S. (2005). Likert scales: How to (ab)use them. Medical Education, 38(12), 1217–1218. https://doi.org/10.1111/j.1365-2929.2004.02012.x
Jezior, J. (2013). Metodologiczne problemy zastosowania skali Likerta w badaniach postaw wobec bezrobocia [Methodological problems of using the Likert scale in research on attitudes towards unemployment]. Przegląd Socjologiczny, 62(1), 117–138.
Johnson, H. M. (1936). Pseudo-mathematics in the mental and social sciences. American Journal of Psychology, 48(3), 342–351.
Kaczmarek, M., & Tarka, P. (2013). Metoda gromadzenia danych a ekwiwalencja wyników pomiaru systemu wartości w 5- i 7-stopniowych skalach ratingowych Likerta [Data collection method and equivalence of value system measurement results in 5- and 7-point Likert rating scales]. Handel Wewnętrzny, 5(346), 42–56.
Kaczmarczyk, S. (2014). Badania marketingowe. Podstawy metodyczne [Marketing research: Methodological foundations]. PWE.
Kampen, J., & Swyngedouw, M. (2000). The ordinal controversy revisited. Quality and Quantity, 34(1), 87–102.
Kero, P., & Lee, D. (2016). Likert is pronounced ‘LICK-urt’ not ‘LIE-kurt’ and the data are ordinal not interval. Journal of Applied Measurement, 17(4), 502–509.
Knapp, T. R. (1990). Treating ordinal scales as interval scales: An attempt to resolve the controversy. Nursing Research, 39(2), 121–123.
Krajewski, W. (1977). Correspondence principle and growth of science. Reidel.
Kuzon, W. M., Urbanchek, M. G., & McCabe, S. (1996). The seven deadly sins of statistical analysis. Annals of Plastic Surgery, 37(3), 265–272.
Lieberson, S. (1964). Limitations in the application of non-parametric coefficients of correlation. American Sociological Review, 29(5), 744–746.
Lissowski, G., Haman, J., & Jasiński, M. (2008). Podstawy statystyki dla socjologów [Fundamentals of statistics for sociologists]. Wydawnictwo Naukowe Scholar.
Likert, R. (1932). A technique for the measurement of attitudes. Archives of Psychology, 22(140), 55.
Mann, H. B., & Whitney, D. R. (1947). On a test of whether one of two random variables is stochastically larger than the other. Annals of Mathematical Statistics, 18, 50–60. https://doi.org/10.1214/aoms/ 1177730491
Mayntz, R., Holm, K., & Hubner, P. (1985). Wprowadzenie do metod socjologii empirycznej [Introduction to methods of empirical sociology]. PWN.
Mitchell, J. (1986). Measurement scales and statistics: A clash of paradigms. Psychological Bulletin, 100(3), 398–407.
Myers, J. L., & Well, A. D. (2003). Research design and statistical analysis (2nd ed.). Lawrence Erlbaum Associates.
Nowak, S. (1973). Teorie postaw [Theories of attitudes]. Państwowe Wydawnictwo Naukowe.
Nowak, S. (1985). Metodologia badań społecznych [Methodology of social research]. Państwowe Wydawnictwo Naukowe.
Pett, M. A. (1997). Nonparametric statistics for health care research. SAGE Publications.
Pearson, K. (1909). On a new method of determining the correlation between a measured character A and a character B. Biometrika, 7, 96–105.
Regenwetter, M., & Dana, J. (2011). Transitivity of preferences. Psychological Review, 118(1), 42–56.
Sagan, A. (2003). Skale i indeksy jako narzędzia pomiaru w badaniach marketingowych [Scales and indices as measurement tools in marketing research]. Zeszyty Naukowe / Akademia Ekonomiczna w Krakowie, 640, 21–36.
Sagan, A. (2014). Wprowadzenie do modelowania zjawisk społecznych i przykłady zastosowań w Statistica [Introduction to modeling social phenomena and examples of applications in Statistica]. StatSoft Polska.
Santina, M., & Perez, J. (2003). Health professionals’ sex and attitudes of health science students to health claims. Medical Education, 37(6), 509–513.
Siegel, S. (1956). Nonparametric statistics for the behavioral sciences. McGraw-Hill.
Sobczyk, M. (2007). Statystyka [Statistics]. Wydawnictwo Naukowe PWN.
Steczkowski, J., & Zeliaś, A. (1981). Statystyczne metody analizy cech jakościowych [Statistical methods of qualitative trait analysis]. PWE.
Stevens, S. S. (1946). On the theory of scales of measurement. Science, 103(2684), 677–680.
Stevens, S. S. (1951). Mathematics, measurement and psychophysics. In S. S. Stevens (Ed.), Handbook of experimental psychology (pp. 1–49). John Wiley & Sons.
Stevens, S. S. (1959). Measurement, psychophysics and utility. In C. W. Churchman & P. Ratoosh (Eds.), Measurement; definitions and theories (pp. 18–61). Wiley.
Szewczak, W. (2010). Jak zmierzyć demokrację? Teoretyczne i metodologiczne podstawy budowy skal demokracji politycznej w politologii porównawczej [How to measure democracy? Theoretical and methodological foundations for constructing democracy scales in comparative political science]. Przegląd Politologiczny, 4, 98–100.
Thomas, M. A. (2019). Mathematization, not measurement: A critique of Stevens’ scales of measurement. Journal of Methods and Measurement in the Social Sciences, 10(2), 76–94.
Thurstone, L. L., & Chave, E. J. (1930). Theory of attitude measurement. In L. L. Thurstone & E. J. Chave (Eds.), The measurement of attitude (pp. 1–21). University of Chicago Press.
Townsend, J. T., & Ashby, F. G. (1984). Measurement scales and statistics: The misconception misconceived. Psychological Review, 96(3), 394–401.
Walesiak, M. (1993). Statystyczna analiza wielowymiarowa w badaniach marketingowych [Multivariate statistical analysis in marketing research]. Prace Naukowe Akademii Ekonomicznej we Wrocławiu, 654.
Walesiak, M. (1996). Metody analizy danych marketingowych [Methods of marketing data analysis]. Wydawnictwo Naukowe PWN.
Walesiak, M. (2014). Wzmacnianie skali pomiaru dla danych porządkowych w statystycznej analizie wielowymiarowej [Strengthening measurement scales for ordinal data in multivariate statistical analysis]. Prace Naukowe Uniwersytetu Ekonomicznego We Wrocławiu, 327, 60–68.
Wiktorowicz, J., Grzelak, M. M., & Grzeszkiewicz-Radulska, K. (2020). Analiza statystyczna z IBM SPSS Statistics [Statistical analysis with IBM SPSS Statistics]. Wydawnictwo Uniwersytetu Łódzkiego. https://doi.org/10.18778/8220-387-5
Wiśniewski, J. W. (1987). Teoria pomiaru a teoria błędów w badaniach statystycznych [Measurement theory and error theory in statistical research]. Wiadomości Statystyczne, 11, 18–20.
Zeller, R. A., & Carmines, E. G. (1980). Measurement in the social sciences: The link between theory and data. American Political Science Review, 76(4), 996–1008.